


Check the meaning of the words in the box and match them with A-E in the charts (Kiểm tra nghĩa của các từ trong khung và nối chúng với A-E trong biểu đồ)
Check the meaning of the words in the box and match them with A-E in the charts (Kiểm tra nghĩa của các từ trong khung và nối chúng với A-E trong biểu đồ)
Câu hỏi trong đề: Bài tập Tiếng anh Unit 1 CLIL có đáp án !!
Quảng cáo
Trả lời:
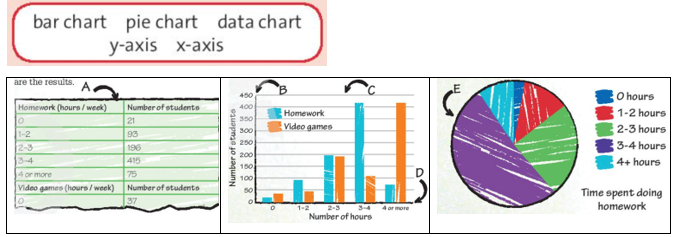
Bar chart = biểu đồ cột (C)
Pie chart = biểu đồ tròn (E)
Data chart = biểu đồ dữ liệu (A)
y-axis = trục y (B)
x-axis = trục x (D)
Hot: 1000+ Đề thi cuối kì 2 file word cấu trúc mới 2026 Toán, Văn, Anh... lớp 1-12 (chỉ từ 60k). Tải ngay
CÂU HỎI HOT CÙNG CHỦ ĐỀ
Lời giải
1. A small number
2. a quarter
3. three
4. Over
5. four
6. two hundred
Hướng dẫn dịch:
Thời gian làm bài: Một số ít học sinh không làm bài tập ở nhà. Gần một phần tư số học sinh làm bài tập về nhà từ hai đến ba giờ. Hơn một nửa số học sinh làm bài tập về nhà hơn ba giờ một tuần.
Thời gian chơi trò chơi điện tử: Hơn 30 học sinh không bao giờ chơi trò chơi điện tử. Hơn một nửa số học sinh dành hơn bốn giờ để chơi trò chơi điện tử. Gần hai trăm sinh viên dành từ hai đến ba giờ để chơi trò chơi điện tử mỗi tuần.
Lời giải
Nghiên cứu và khảo sát thời gian rảnh
Bạn có dành nhiều thời gian hơn để làm bài tập về nhà hoặc chơi trò chơi điện tử không? Rất nhiều học sinh nghĩ rằng họ dành nhiều thời gian hơn để làm bài tập. Nhưng điều này có đúng không? Lớp mình đã làm một cuộc khảo sát để kiểm tra. Trong cuộc khảo sát, chúng tôi hỏi sinh viên số giờ họ dành để làm việc nhà và chơi trò chơi điện tử mỗi tuần. Có 800 học sinh trong trường của chúng tôi. Chúng tôi hỏi tất cả các sinh viên hai câu hỏi:
Bạn dành bao nhiêu giờ để làm bài tập về nhà mỗi tuần?
Bạn dành bao nhiêu giờ để chơi trò chơi điện tử mỗi tuần?
Chúng tôi đã trình bày dữ liệu trong ba biểu đồ khác nhau. Đây là kết quả.
Đáp án:
The pie chart gave no information about time spent on video games.
(Biểu đồ hình tròn không có thông tin về thời gian dành cho trò chơi điện tử.)
Lời giải
Bạn cần đăng ký gói VIP ( giá chỉ từ 250K ) để làm bài, xem đáp án và lời giải chi tiết không giới hạn.