


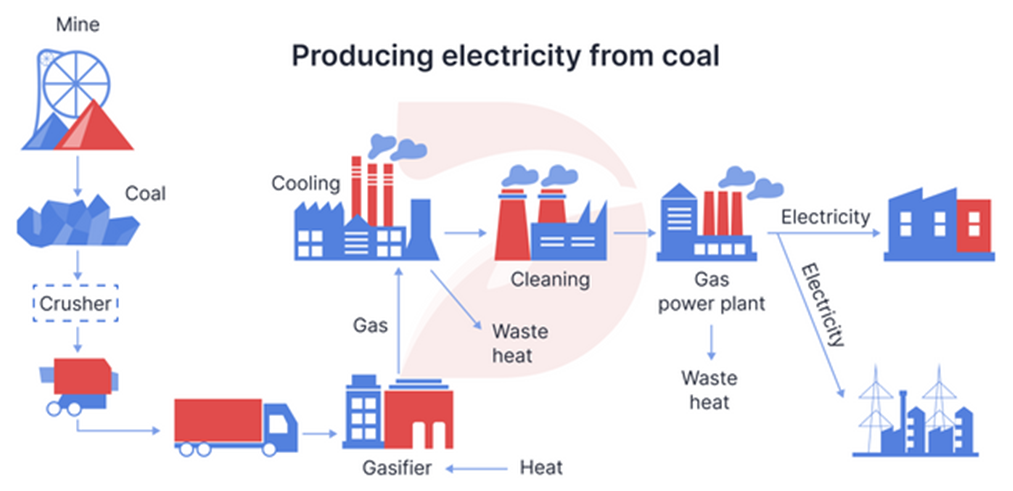
The diagram below shows how one type of coal is used to produce electricity.
Summarise the information by selecting and reporting the main features, and make comparisons where relevant. Write at least 150 words.
The diagram below shows how one type of coal is used to produce electricity.
Summarise the information by selecting and reporting the main features, and make comparisons where relevant. Write at least 150 words.
Câu hỏi trong đề: 2000 câu trắc nghiệm tổng hợp Tiếng Anh 2025 có đáp án !!
Quảng cáo
Trả lời:
Sample 1:
The provided diagram illustrates how electricity is generated from coal.
Overall, the process includes several key stages, beginning with coal mining and culminating in power delivery to households and industries, with waste heat being a by-product at various stages.
The first step involves coal being mined at extraction plants. The mined coal subsequently undergoes crushing, breaking it down into finer pieces. These crushed coal fragments are then transported to a gasifier, inside which combustion occurs at elevated temperatures in order to convert the coal into gas.
After this phase is complete, the produced gas proceeds to a separate facility for cooling, with excess heat released as waste. Once cooled, the gas undergoes a cleaning stage whereby any impurities are removed. The purified gas then becomes the input for a gas power plant. Within the power plant, electricity is generated and distributed for domestic and industrial use. It is worth noting that even at this final stage, additional waste heat is still discharged as a by-product.
Sample 2:
The illustration demonstrates the generation of electricity by utilizing a particular type of coal. Overall, there are eight steps in the production, beginning with mining the coal, followed by various processes to the raw material, and ending with distributing the electricity to final uses.
The first five steps involve the conversion of coal into gas, which begins with coal being excavated from a mining plant. After that, it goes through a crushing machine and is delivered by trucks to another factory, where a gasification process transforms the crushed coal into gas. Subsequently, another facility is responsible for lowering the temperature of the gas and releasing the waste heat.
The remaining steps produce electricity. Cool gas is transported to another unit for cleaning and then becomes the input for a gas power plant. While electricity is generated, excessive heat is released as a source of waste. Finally, the electricity produced from the power plant is supplied for both household and industrial uses.
Sample 3:
The diagram illustrates the process of generating electricity from a particular kind of coal.
Overall, this process comprises multiple steps occurring at different facilities: starting from the mining of the coal to the production of gas, and eventually the generation of electrical power used for various purposes.
To begin with, coal is extracted from a mine, after which it is ground down by a crusher. The pulverized coal is then put into a mine cart before being loaded onto a truck for transportation. Once this material has been transported to the factory, it is heated to produce gas.
The process continues with the gas being sent to a separate facility, in which it is cooled while waste heat is discharged. After the cooling process is complete, the gas will be directed to a facility where it is purified. It is thereafter transferred once again to a power plant which uses the gas to generate electricity and expel any excess heat waste. Finally, the electricity produced is distributed via transmission lines to homes and industries.
Sample 4:
The drawing demonstrates how electricity is generated from a type of coal.
Overall, it can be seen that there are eight stages included in this procedure, commencing with the extraction of coal and completing with production of electricity. Also, the process takes place at a coal mine and several treatment facilities.
In the initial stage, coal is collected from coal mines. After undergoing a crushing stage, the coal is transported by trucks to a gasifier. This is where high temperatures are introduced, and the pulverized coal is heated and turned into gas, ready for the next steps.
The subsequent stage involves gas being delivered to a cooling plant from the gasifier. Following this, some of this gas is transported to another factory for cleaning, while waste heat is disposed of. After being cleaned, the gas is moved to a power plant to be converted into electricity. Finally, the generated electricity is distributed to households and factories, with waste heat being removed.
Sample 5:
The diagram illustrates how to generate electricity from coal.
Overall, the process comprises several stages, starting with the mining and crushing of coal, followed by the heating and cleaning of gas, and culminating in the generation and allocation of electricity.
At the start of the process, coal is extracted from a mine before being transported to a crusher, where it is broken down into smaller pieces in order to burn more efficiently. The coal lumps are then subjected to high temperatures in a gasifier, triggering a combustion reaction as gas and other by-products are produced. Subsequently, the gas is cooled down while the waste heat is released.
The process continues with the gas being cleansed to remove impurities, after which it is pumped into a gas power plant where electricity is generated. During this stage, more waste heat is discharged into the atmosphere. Finally, electricity is distributed to various households and industries.
Sample 6:
The diagram illustrates the various steps involved in the production of electricity from coal.
Overall, the procedure consists of six primary steps, beginning with the extraction of coal from mine and culminating in the distribution of electricity to the grid.
The process initiates at a coal mine, where coal is extracted and then transported to a crusher to be pulverized into small pieces. Following this, the crushed coal is conveyed to gasifiers, where it undergoes heating to transform into gas, followed by a cooling phase. During this phase, the waste heat generated in the gasifier can be later extracted and managed.
Once gasified, the coal-derived gas is cleaned to remove impurities, rendering it suitable for efficient power generation. The purified gas is then directed into a gas power plant where it fuels turbines to produce electricity. Finally, this resulting electricity is distributed to the grid and for consumer use.
Sample 7:
The given picture illustrates how a certain type of coal is used to generate electricity. Overall, there are three main stages in this process. It starts with the extraction of coal, continues with processing this material to generate electricity and culminates with distributing electricity to various locations for household and industrial purposes.
Regarding the material preparation stage, a specific type of coal is mined from coal mines using specialised equipment. It is then ground by crushers and dumped into crates. Finally, the crushed coal is delivered by trucks to thermal power plants.
Concerning the production and delivery stages, the coal received at the plant is first gasified using heat. The gas produced is subsequently pumped into a cooling system where waste heat is released. The following step involves cleaning the gas to remove any impurities before it is utilised to produce electricity in a power plant. At this plant, another volume of waste heat is also released, and the electricity is finally distributed to households for domestic use or to industrial areas.
Sample 8:
The diagram delineates the sequential stages involved in generating electricity from coal.
Overall, the process encompasses six primary stages, commencing with coal extraction from mine and concluding with electricity transmission to the grid.
The procedure starts by excavating coal from mines, followed by transportation to a crusher for pulverization into small fragments. Subsequently, the crushed coal is conveyed to gasifiers, where it undergoes heating to convert into gas before a cooling phase. Throughout this phase, the residual heat generated in the gasifier can be harnessed and managed.
Following gasification, the coal-derived gas goes through purification to eliminate impurities, ensuring optimal efficiency in power generation. The refined gas is then channeled into a gas power plant where it drives turbines to generate electricity. Ultimately, the produced electricity is distributed to the grid and made available for consumer use.
Sample 9:
The diagram illustrates the sequential phases involved in harnessing electricity from a specific type of coal.
To commence with, the coal extraction process begins with mining deep underground, followed by crushing to facilitate combustion. Following this initial phase, the crushed coal is transported via lorry to the factory, where it is introduced into a gasifier for combustion, transforming coal into raw syngas. Subsequently, after the syngas undergoes cooling, eliminating excess heat, it undergoes a purification process to remove impurities and pollutants, including carbon dioxide, mercury, and sulfur, ensuring minimal environmental impact. The purified gas is then utilized to drive a gas turbine within a power plant, generating electricity while waste heat is efficiently managed. Ultimately, the electricity generated is distributed across residential and industrial sectors through the national grid.
Overall, the process of generating electricity from coal involves several crucial stages, starting from coal mining and culminating in electricity distribution. This method boasts environmental friendliness by minimizing harmful emissions into the atmosphere.
Hot: 1000+ Đề thi cuối kì 2 file word cấu trúc mới 2026 Toán, Văn, Anh... lớp 1-12 (chỉ từ 60k). Tải ngay
CÂU HỎI HOT CÙNG CHỦ ĐỀ
Lời giải

Sample 1:
The bar graph illustrates the overseas students' spending on accommodation, tuition, and living expenses, while the table depicts information about the average weekly expenses by international students in four countries: A, B, C, and D.
Overall, foreign students need to spend the highest in country A and the lowest in D. In nearly every nation, the international students’ weekly average living expenses are the greatest, while their housing cost registers the lowest.
The costliest country for studying is A, with a weekly average expense of 875 dollars. This is followed by B, C, and D, which have weekly expenses of 735, 540, and 435 dollars, respectively. However, foreign students always pay the least for accommodation, which incurs on average weekly 220, 280, 240, and 200 dollars in the nations A, B, C, and D, respectively.
On the other hand, living expenditures account for the highest portion of average weekly costs for international students in countries A, B, and C, with 430, 350, and 275 dollars, correspondingly. Tuition fees in the same countries (A, B and C) come in second with the weekly averages of 358, 320, and 250 dollars in order. However, D is the only nation where education accounts for the highest average spending area, coming in at USD 235, followed by the cost of living (USD 225) and housing (USD 200).
Sample 2:
The table illustrates information regarding the weekly spendings by overseas students in four countries, A, B, C and D, while the bar graph depicts the students’ expenditure on the sectors, housing, education fees and living expenses.
Overall, the cost of studying abroad is the highest in country A and the lowest in D. Apart from country D, living costs account for the most part of the weekly spendings in all countries, while accommodation registers the least.
Regarding the total cost of studying, A is the most expensive country with weekly average 875 dollars, followed by B, C and D with 735, 540 and 435 dollars, respectively. On the other hand, the overseas students always spend the least on accommodation, which are on average weekly 220, 280, 240 and 200 dollars in the corresponding countries A, B, C and D.
Considering the living cost, it takes the largest share of foreign students’ average weekly expenses in countries A, B, and C with 430, 350 and 275 dollars, respectively, while tuition fees in the same countries hold the second place with weekly average 358, 320 and 250 dollars, sequentially. However, D is the only country where tuition fee occupies the highest expenditure with average weekly 235 dollars, followed by living cost (USD 225) and accommodation (USD 200.)
Sample 3:
The table and bar graph depict information regarding the weekly spendings by overseas students in countries A, B C and D.
Overall, there are three elements, housing, school fees and living costs that contribute to the total weekly spendings. The total expenditure in country A is the highest while it is the lowest in country D. Living costs account for the most part of the weekly spendings in all countries except D.
The total mean weekly cost for pupils to study in country A is US$875, next by country B at US$735, and then by country C at US$540, and finally by country D at US$435. The living costs are always the biggest component of the expenditure except for country D, with about US$10 less than the major spending which is the school fees.
Accommodation accounts for the least among all spendings in all countries. The most expensive housing is found in country B, at US$280, and the cheapest in country D at US$200. The middle range can be seen in country A at US$220 and country C at US$240, respectively. Costs of the tuition fee range between US$ 358 and US$235 in country A and D, in order.
Lời giải

Sample 1:
The bar chart and pie chart give information about why US residents travelled and what travel problems they experienced in the year 2009.
It is clear that the principal reason why Americans travelled in 2009 was to commute to and from work. In the same year, the primary concern of Americans, with regard to the trips they made, was the cost of travelling.
Looking more closely at the bar chart, we can see that 49% of the trips made by Americans in 2009 were for the purpose of commuting. By contrast, only 6% of trips were visits to friends or relatives, and one in ten trips were for social or recreation reasons. Shopping was cited as the reason for 16% of all travel, while unspecific ‘personal reasons’ accounted for the remaining 19%.
According to the pie chart, price was the key consideration for 36% of American travellers. Almost one in five people cited safety as their foremost travel concern, while aggressive driving and highway congestion were the main issues for 17% and 14% of the travelling public. Finally, a total of 14% of those surveyed thought that access to public transport or space for pedestrians were the most important travel issues.
Sample 2:
The bar chart compares the figures for Americans going out for five reasons and the pie chart illustrates the percentage of six problems that concerned them when travelling in 2009. Overall, it is clear that the main reason why people in the US went out in 2009 is to commute to work, and the cost of travelling is the problem concerning them the most.
Looking first at the bar graph, the proportion of Americans going out for commuting to work stood at 49%, while the figure for those leaving their house for personal reasons accounted for 19%. In addition, the rate of people in the US going out for shopping and recreation made up 16% and 10%, respectively, while visiting friends or relatives accounted for the lowest percentage, at only 6%.
Turning to the pie chart, the cost of travelling was the most concerning problem of Americans when going out, with the figure making up 36%, while the proportion of safety concerns is half of that, at 19%. In addition, 17% of US citizens were concerned about aggressive drivers, while highway congestion made 14% of them worried when leaving their house. Access to public transportation and places for people to walk accounted for the lowest percentages, at only 8% and 6%, respectively.
Sample 3:
The provided charts offer insights into the reasons for travel and the primary concerns faced by the traveling public in the United States during the year 2009. The data is presented through a bar chart illustrating travel purposes and a pie chart highlighting key issues.
Notably, the primary motivation for travel among Americans in 2009 was commuting to and from work. Simultaneously, the major concern for the traveling public during their trips revolved around the cost associated with travel.
Examining the bar chart in detail reveals that almost half of the trips made by Americans in 2009, precisely 49%, were attributed to commuting. Conversely, visits to friends or relatives accounted for a mere 6%, while social or recreational trips constituted one in ten journeys. Shopping emerged as the purpose for 16% of all travel, leaving the remaining 19% for unspecific ‘personal reasons.’
Turning attention to the pie chart, it becomes evident that cost was the primary consideration for 36% of American travelers. Safety closely followed, with nearly one in five people, or 19%, expressing it as their foremost travel concern. Aggressive driving and highway congestion were significant issues for 17% and 14% of the traveling public, respectively. Additionally, 14% of respondents identified access to public transport or space for pedestrians as the most crucial travel issues.
Sample 4:
The bar chart shows why American people chose to travel, and the pie chart shows the main issues for the travelling public in the USA, both for 2009. The trend suggests that the reason and price were the main issues for travel in the United States. It is clear that commuting from work was reported as the biggest contribution to travel, at 49%. People who went travelling for personal reasons and shopping accounted for 35% when these two groups are combined. However, interaction with friends and relatives only accounted for 25% less than the above categories. And social and recreational activities took up only 6%, which was the lowest figure by more than 43%. The travelling public’s main issues were related to price and safety, with 55% of respondents reporting these two issues. While other issues accounted for a relatively small part. Only 17% of the respondents reported issues with aggressive drivers, while highway congestion accounted for even less at 14% of the issues reported. The percentage of access to public transport and space for pedestrians was much lower than the other categories at less than 10% for both. To conclude, price and commuting time were the dominant factors relating to travel in the US in 2009.
Lời giải
Bạn cần đăng ký gói VIP ( giá chỉ từ 250K ) để làm bài, xem đáp án và lời giải chi tiết không giới hạn.
Lời giải
Bạn cần đăng ký gói VIP ( giá chỉ từ 250K ) để làm bài, xem đáp án và lời giải chi tiết không giới hạn.
Lời giải
Bạn cần đăng ký gói VIP ( giá chỉ từ 250K ) để làm bài, xem đáp án và lời giải chi tiết không giới hạn.
Lời giải
Bạn cần đăng ký gói VIP ( giá chỉ từ 250K ) để làm bài, xem đáp án và lời giải chi tiết không giới hạn.
Lời giải
Bạn cần đăng ký gói VIP ( giá chỉ từ 250K ) để làm bài, xem đáp án và lời giải chi tiết không giới hạn.