


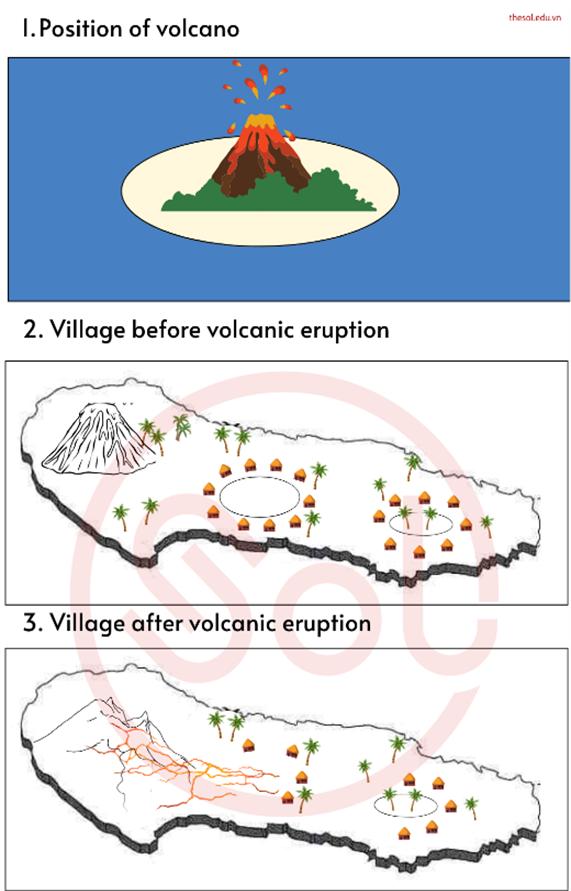
The three pictures show the position of a volcano, and a village before and after volcanic eruption.
Summarise the information by selecting and reporting the main features, and make comparisons where relevant. Write at least 150 words.
Summarise the information by selecting and reporting the main features, and make comparisons where relevant. Write at least 150 words.
Câu hỏi trong đề: 2000 câu trắc nghiệm tổng hợp Tiếng Anh 2025 có đáp án !!
Quảng cáo
Trả lời:
Sample 1:
The series of illustrations describe the geographical layout of a volcano alongside a village prior to and subsequent to a volcanic eruption.
Overall, the eruption has led to significant geographical and societal changes, eradicating a central lake, destroying a substantial portion of the village, and likely forcing the inhabitants to seek safer dwellings elsewhere.
Initially, the volcano is situated on the western flank of the island, with its apex intact, suggesting dormancy, and the village is predominantly established in the central and eastern parts of the island, circumventing two lakes. The larger lake, located centrally, is encircled by numerous houses, indicative of a thriving community, while the smaller lake to the east has fewer dwellings, potentially reflecting a less dense population. Palm trees are interspersed throughout, denoting a tropical climate.
Following the volcanic eruption, the transformation of the landscape is stark. The volcano's peak has been obliterated, leaving a rugged opening from which the eruption likely occurred. The illustration shows signs of lava flow, which has extended to the areas where the village once thrived. The houses closest to the volcano have been completely destroyed, and some palm trees have vanished, presumably incinerated or buried under the volcanic debris. A reduced number of houses suggest either a migration or a loss of population.
Sample 2:
The three illustrations depict the location of a volcano alongside a village before and after the eruption.
Overall, the illustrations show significant changes in the landscape due to the eruption. In the first illustration, there are two main areas: a volcano on the left-hand side and a village on the right. Following the eruption, the devastation caused by lava flow is evident, with many trees and houses near the volcano swept away.
The position of the volcano remains unchanged, but the lava spreads out towards the east, reaching the middle of the island. Additionally, a massive landslide triggers debris avalanches, resulting in a decrease in the volcano's height and the destruction of green spaces to the northeast and southeast.
As for the villages, they are depicted as circular areas with houses and trees. In the second illustration, more than half of the houses in the central area of one village are destroyed, leading to the deformation of the original circle. However, the other village remains unaffected by the eruption.
Sample 3:
The three images display the location of an active volcano and the changes that happened to a nearby village following the volcano’s eruption. Overall, it can be seen that the catastrophic event has damaged the region surrounding the volcano and reduced the habitable area in the village.
The volcano is situated near the western edge of the island it is on and flanked by greenery. The village, meanwhile, occupies the middle and eastern sections of the island, with two clusters of its inhabitants’ accommodation. Prior to the volcanic eruption, the village was densely populated based on the number of buildings, and within each cluster, there was a pathing circle.
After the devastation brought about by the volcano, much has changed in the landscape. Most of the greenery in the volcano’s proximity has disappeared, while lava has spread all the way to the middle section of the island. As a result, over half of the building cluster in the center, and its pathing circle, no longer exists. The other populated section has stayed intact in terms of vegetation, but there are also fewer buildings following the catastrophe. The remaining accommodation in each area could be seen to the east of each respective one.
Sample 4:
The maps demonstrate the location of a volcano, and a village after the volcano erupted.
Overall, the natural disaster made the austere rural area become less green. In particular, the place got thinly populated, and the trees were on a sharp decrease.
Specifically, the volcano constituted one third of the square area of the countryside in the West. After that, it broke out, and its lava spread to the center of the village, which caused many losses. It is striking that plenty of the surrounding trees were burnt due to the eruption. In terms of accommodation, the residential area in the middle was more crowded than the one in the East, and their houses were linked together by footpaths. When the phenonemon happened, the central housing area as well as its ring was demolished up to 60%.
Finally, the way and trees dotted in the second demographic region remained unspoilt whilst it recorded a downturn in the number of huts at 40%.
Hot: 1000+ Đề thi cuối kì 2 file word cấu trúc mới 2026 Toán, Văn, Anh... lớp 1-12 (chỉ từ 60k). Tải ngay
CÂU HỎI HOT CÙNG CHỦ ĐỀ
Lời giải

Sample 1:
The bar graph illustrates the overseas students' spending on accommodation, tuition, and living expenses, while the table depicts information about the average weekly expenses by international students in four countries: A, B, C, and D.
Overall, foreign students need to spend the highest in country A and the lowest in D. In nearly every nation, the international students’ weekly average living expenses are the greatest, while their housing cost registers the lowest.
The costliest country for studying is A, with a weekly average expense of 875 dollars. This is followed by B, C, and D, which have weekly expenses of 735, 540, and 435 dollars, respectively. However, foreign students always pay the least for accommodation, which incurs on average weekly 220, 280, 240, and 200 dollars in the nations A, B, C, and D, respectively.
On the other hand, living expenditures account for the highest portion of average weekly costs for international students in countries A, B, and C, with 430, 350, and 275 dollars, correspondingly. Tuition fees in the same countries (A, B and C) come in second with the weekly averages of 358, 320, and 250 dollars in order. However, D is the only nation where education accounts for the highest average spending area, coming in at USD 235, followed by the cost of living (USD 225) and housing (USD 200).
Sample 2:
The table illustrates information regarding the weekly spendings by overseas students in four countries, A, B, C and D, while the bar graph depicts the students’ expenditure on the sectors, housing, education fees and living expenses.
Overall, the cost of studying abroad is the highest in country A and the lowest in D. Apart from country D, living costs account for the most part of the weekly spendings in all countries, while accommodation registers the least.
Regarding the total cost of studying, A is the most expensive country with weekly average 875 dollars, followed by B, C and D with 735, 540 and 435 dollars, respectively. On the other hand, the overseas students always spend the least on accommodation, which are on average weekly 220, 280, 240 and 200 dollars in the corresponding countries A, B, C and D.
Considering the living cost, it takes the largest share of foreign students’ average weekly expenses in countries A, B, and C with 430, 350 and 275 dollars, respectively, while tuition fees in the same countries hold the second place with weekly average 358, 320 and 250 dollars, sequentially. However, D is the only country where tuition fee occupies the highest expenditure with average weekly 235 dollars, followed by living cost (USD 225) and accommodation (USD 200.)
Sample 3:
The table and bar graph depict information regarding the weekly spendings by overseas students in countries A, B C and D.
Overall, there are three elements, housing, school fees and living costs that contribute to the total weekly spendings. The total expenditure in country A is the highest while it is the lowest in country D. Living costs account for the most part of the weekly spendings in all countries except D.
The total mean weekly cost for pupils to study in country A is US$875, next by country B at US$735, and then by country C at US$540, and finally by country D at US$435. The living costs are always the biggest component of the expenditure except for country D, with about US$10 less than the major spending which is the school fees.
Accommodation accounts for the least among all spendings in all countries. The most expensive housing is found in country B, at US$280, and the cheapest in country D at US$200. The middle range can be seen in country A at US$220 and country C at US$240, respectively. Costs of the tuition fee range between US$ 358 and US$235 in country A and D, in order.
Lời giải

Sample 1:
The bar chart and pie chart give information about why US residents travelled and what travel problems they experienced in the year 2009.
It is clear that the principal reason why Americans travelled in 2009 was to commute to and from work. In the same year, the primary concern of Americans, with regard to the trips they made, was the cost of travelling.
Looking more closely at the bar chart, we can see that 49% of the trips made by Americans in 2009 were for the purpose of commuting. By contrast, only 6% of trips were visits to friends or relatives, and one in ten trips were for social or recreation reasons. Shopping was cited as the reason for 16% of all travel, while unspecific ‘personal reasons’ accounted for the remaining 19%.
According to the pie chart, price was the key consideration for 36% of American travellers. Almost one in five people cited safety as their foremost travel concern, while aggressive driving and highway congestion were the main issues for 17% and 14% of the travelling public. Finally, a total of 14% of those surveyed thought that access to public transport or space for pedestrians were the most important travel issues.
Sample 2:
The bar chart compares the figures for Americans going out for five reasons and the pie chart illustrates the percentage of six problems that concerned them when travelling in 2009. Overall, it is clear that the main reason why people in the US went out in 2009 is to commute to work, and the cost of travelling is the problem concerning them the most.
Looking first at the bar graph, the proportion of Americans going out for commuting to work stood at 49%, while the figure for those leaving their house for personal reasons accounted for 19%. In addition, the rate of people in the US going out for shopping and recreation made up 16% and 10%, respectively, while visiting friends or relatives accounted for the lowest percentage, at only 6%.
Turning to the pie chart, the cost of travelling was the most concerning problem of Americans when going out, with the figure making up 36%, while the proportion of safety concerns is half of that, at 19%. In addition, 17% of US citizens were concerned about aggressive drivers, while highway congestion made 14% of them worried when leaving their house. Access to public transportation and places for people to walk accounted for the lowest percentages, at only 8% and 6%, respectively.
Sample 3:
The provided charts offer insights into the reasons for travel and the primary concerns faced by the traveling public in the United States during the year 2009. The data is presented through a bar chart illustrating travel purposes and a pie chart highlighting key issues.
Notably, the primary motivation for travel among Americans in 2009 was commuting to and from work. Simultaneously, the major concern for the traveling public during their trips revolved around the cost associated with travel.
Examining the bar chart in detail reveals that almost half of the trips made by Americans in 2009, precisely 49%, were attributed to commuting. Conversely, visits to friends or relatives accounted for a mere 6%, while social or recreational trips constituted one in ten journeys. Shopping emerged as the purpose for 16% of all travel, leaving the remaining 19% for unspecific ‘personal reasons.’
Turning attention to the pie chart, it becomes evident that cost was the primary consideration for 36% of American travelers. Safety closely followed, with nearly one in five people, or 19%, expressing it as their foremost travel concern. Aggressive driving and highway congestion were significant issues for 17% and 14% of the traveling public, respectively. Additionally, 14% of respondents identified access to public transport or space for pedestrians as the most crucial travel issues.
Sample 4:
The bar chart shows why American people chose to travel, and the pie chart shows the main issues for the travelling public in the USA, both for 2009. The trend suggests that the reason and price were the main issues for travel in the United States. It is clear that commuting from work was reported as the biggest contribution to travel, at 49%. People who went travelling for personal reasons and shopping accounted for 35% when these two groups are combined. However, interaction with friends and relatives only accounted for 25% less than the above categories. And social and recreational activities took up only 6%, which was the lowest figure by more than 43%. The travelling public’s main issues were related to price and safety, with 55% of respondents reporting these two issues. While other issues accounted for a relatively small part. Only 17% of the respondents reported issues with aggressive drivers, while highway congestion accounted for even less at 14% of the issues reported. The percentage of access to public transport and space for pedestrians was much lower than the other categories at less than 10% for both. To conclude, price and commuting time were the dominant factors relating to travel in the US in 2009.
Lời giải
Bạn cần đăng ký gói VIP ( giá chỉ từ 250K ) để làm bài, xem đáp án và lời giải chi tiết không giới hạn.
Lời giải
Bạn cần đăng ký gói VIP ( giá chỉ từ 250K ) để làm bài, xem đáp án và lời giải chi tiết không giới hạn.
Lời giải
Bạn cần đăng ký gói VIP ( giá chỉ từ 250K ) để làm bài, xem đáp án và lời giải chi tiết không giới hạn.
Lời giải
Bạn cần đăng ký gói VIP ( giá chỉ từ 250K ) để làm bài, xem đáp án và lời giải chi tiết không giới hạn.
Lời giải
Bạn cần đăng ký gói VIP ( giá chỉ từ 250K ) để làm bài, xem đáp án và lời giải chi tiết không giới hạn.