


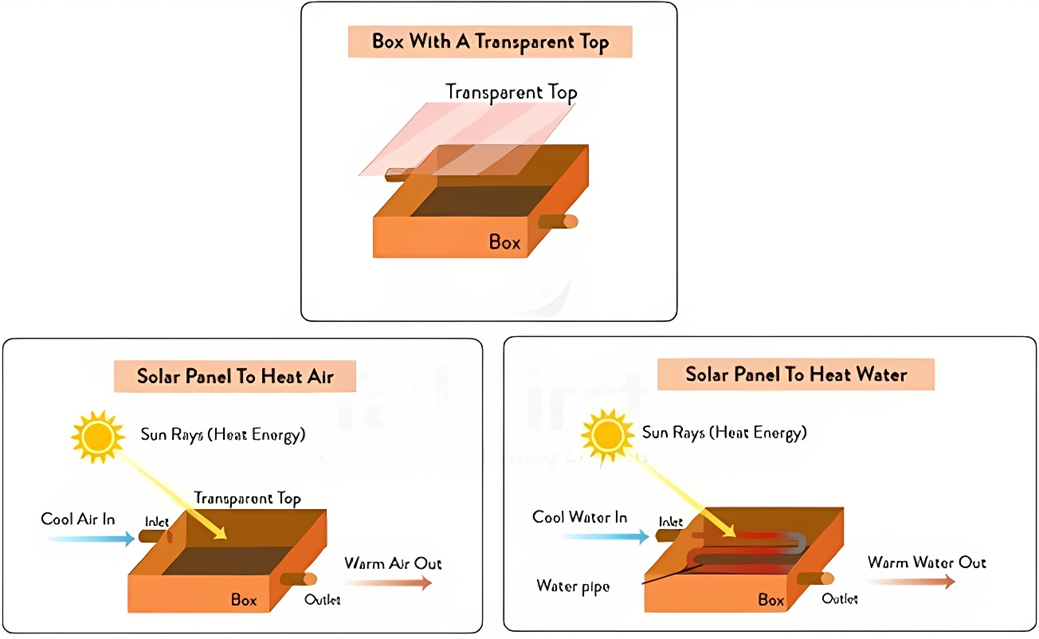
The diagrams show the structure of the solar panel and its use.
Summarise the information by selecting and reporting the main features, and make comparisons where relevant. Write at least 150 words.
The diagrams show the structure of the solar panel and its use.
Summarise the information by selecting and reporting the main features, and make comparisons where relevant. Write at least 150 words.
Câu hỏi trong đề: 2000 câu trắc nghiệm tổng hợp Tiếng Anh 2025 có đáp án !!
Quảng cáo
Trả lời:
Sample 1:
The charts illustrate the characteristics of solar panels and two possible uses. Firstly, the basic structure of a solar panel is shown, then how the warming process of air or water works.
Regarding the structure, it can be seen that a solar panel is formed by approximately a box, which has an inlet on one side and an outlet on the other side. This box has on it a transparent glass that seals it and that is the part through which sun rays will pass.
Under the image describing the physical feats, some functions are explained. In particular, the first possible use of a solar panel is to generate warm air. This function is possible by letting air enter the box from the inlet and once it is in, letting it heat up thanks to the sun rays that get refracted by the glass, thus creating warmer air that will be let flow from the outlet. On the other hand, an additional step is required to heat up water. More specifically, a tube that connects the inlet and the outlet is needed to let the water flow through it. Given this, the principle is the same, with solar energy heating up the water inside the tube, which will enter from one side and exit from the other.
In conclusion, it can be stated that this simple model can explain the basic principles of a solar panel, even if it is not an accurate representation.
Sample 2:
The diagrams provide an overview of the structure and functionality of a solar panel. They depict the key components of a solar panel, as well as how it harnesses solar energy to generate warm air or water.
Starting with the first diagram, it showcases the structural elements of a basic solar panel. The panel consists of a transparent glass sheet placed on top, along with an inlet pipe and an outlet pipe located on opposite sides.
Moving on to the second diagram, positioned on the left, it illustrates the process of solar energy absorption. Sunlight penetrates the transparent glass, heating the air that enters the panel through the inlet pipe. Consequently, the warmed air flows out of the panel through the outlet pipe, providing a source of warm air.
The final diagram demonstrates the solar panel's capability to produce warm water. Water enters the panel through an inlet pipe, which then circulates in an 'S'-shaped pipe within the panel. As the sun's rays shine on the panel, the water within the pipe absorbs the heat and exits the panel through the outlet pipe, delivering warm water for various purposes.
Sample 3:
The charts outline the characteristics of sun-based boards and two conceivable employments. Firstly, the fundamental structure of a sun-based board is appeared, at that point how the warming handle of discuss or water works.
With respect to the structure, it can be seen that a sun-oriented board is shaped by roughly a box, which has a gulf on one side and an outlet on the other side. This box has on it a straightforward glass, that seals it which is the portion through which sun beams will pass. Beneath the picture depicting the physical accomplishments, a few capacities are clarified. In specific, the primary conceivable utilization of a sun-based board is to produce warm discuss. This work is conceivable by letting discussion enter the box from the gulf and once it is in, letting it warm up much obliged to the sunbeams that get refracted by the glass, in this way making hotter discussion that will be let stream from the outlet.
On the other hand, an extra step is required to warm up the water. More particularly, a tube that interfaces the gulf and the outlet is required to let the water stream through it. Given this, the rule is the same, with sun-oriented vitality warming up the water interior the tube, which is able to enter from one side and exit from the other.
In conclusion, it can be stated that this basic demonstration can clarify the fundamental standards of a sun-oriented board, indeed in case it isn't an exact representation.
Sample 4:
The given pictures illustrate how a basic sun-oriented board is developed and its applications. In general, this sun-oriented board can be partitioned into two major parts: a square cover and a holder. It is additionally famous that this framework is utilized to warm the discuss or water with the bolster of sun-powered control.
With respect to the plan of the sun-powered board, there's a holder which has two tubes for the input and yield on either side. At the same time, on the beat of the holder, a rectangular straightforward glass is utilized as a cover that retains the sunbeams and after that changes over to vitality.
In terms of the applications, for warming discussion purposes, this sun-based panel gets the crude discussion through the cleared outside tube. After that, it'll be warmed beneath the sunbeams interior the holder some time recently going through the proper side tube as warm discuss. Be that as it may, for the warming water reason, the holder too has an extra bent pipeline. So also, to the air, water is channeled through the entrance on the cleared outside to the crisscross pipe within the holder and after that is bubbled by the daylight. At last, the conducted water gets away by the proper side.
Sample 5:
The given graph shows the structure of a sun-oriented board to warm water and wind. In general, there are two diverse graphs including an arrangement of steps starting from the channel of cool air/water in and ending with the outlet of warm air/water out. To start with, the beat of the box is secured by transparent glass, so it'll get coordinate daylight.
There are two parts: sun-based boards to hot wind and sun-based boards to hot fluid. Firstly, cold air is collected in a box with the assistance of gulf and due to coordinate sun beams cold wind is exchanged to hot discuss and it gets out through the outlet.
Secondly, the same concept is taken after for hot liqued but there's one alter, in a box water pipe is found from which cold water is transferred to hot water with the assistance of coordinated warm vitality which is hitting within the straightforward best of the box.
Sample 6:
The diagrams illustrate the design of a simple solar panel and the process by which it generates energy.
Overall, the structure of the panel is not complex, consisting of only a few details. This structure enables the panel to utilize sunshine, which heats up either air or water
To begin with, the layout of the panel is relatively simple. It is a rectangular container, with the surface layer made of transparent glass. In addition, there is an inlet and outlet on either side of the container, allowing water and air to flow through the system.
The energy generation process works by using solar power. Firstly, sun rays are absorbed by the transparent glass, thereby capturing the heat of these rays of sunlight inside the panel. This captured energy then turns air flowing through the system into warm air. Likewise, if the system contains water inside, it is also heated in a similar manner to air.
Sample 7:
The given diagram gives information on how a simple solar panel is constructed and how it can be used to heat up air and water.
By and large, the structure of the solar panel can be described as minimal since it only consists of four components: a transparent glass, a square dark box, an inlet, and an outlet.
First, lying on top of the solar panel is a see-through square piece of glass. This glass allows sun rays to pass through to be converted into thermal energy. Next, a container can be found underneath the glass. On its left-hand side, there is an inlet that acts as an entrance for air and water. At the same time, on the right side, an outlet is located and serves as an exit for transformed contents.
When air travels through the container, its temperature is raised by the generated energy. Likewise, when water is channeled through the inlet, it travels through a zigzag pipe, inside which it will be heated to cater to the domestic water use of households.
Sample 8:
The illustrations depict the design of a solar panel and its application.
Overall, the solar panel displays a relatively straightforward structure, comprising only four components. This solar panel is capable of heating up air or water by harnessing sunshine.
As for the design of this solar panel, its body is made of a hollow rectangular box topped with a piece of transparent glass. In addition, there is an inlet attached to one side that allows water or air to enter and then exit through an outlet on the opposite side. In order for water to travel within the system, additional tubing needs to be installed inside, which is not required for air.
By utilizing solar power, this device can be used to warm either air or water. Initially, energy from the sun, in the form of sun rays, is absorbed by the transparent glass surface, heating up the enclosed space inside the panel. This heated space subsequently transforms the air or water circulating through it into a warmer state, eventually escaping the system through the outlet.
Sample 9:
The picture illustrates the composition and function of an environmentally friendly system that utilizes sunlight to generate hot air and water. Overall, the system is relatively basic in terms of structure and mechanism except that the water heater includes a metal zigzag pipe to conduct heat.
The design consisted of a square-shaped metal compartment with an open top, where a sheet of transparent glass can be placed. Moreover, two holes are drilled on opposite sides, acting as an inlet and outlet.
Regarding the working principle, the panel can be used for generating either warm water or air. Firstly, air or water enters the compartment through the inlet, in which the sun’s radiation is absorbed and subsequently converted into usable energy. Heat collected from the solar conductors then heats up water or air, before being pumped out of the outlet for domestic use.
Sample 10:
The provided diagrams illustrate how a solar panel is constructed and used. It is noticeable that the structure of the system is relatively simple, and its function is to heat up air or water by using solar power.
Regarding the design of the solar panel, there is a container with an inlet and an outlet on either side. The inlet serves as an entrance for air and water while the outlet is where the warm air or water escapes. A sheet of transparent glass is placed above the compartment to capture the sun rays.
At the beginning of the process, the sun rays onto the transparent glass are absorbed and converted into energy. When the air is channeled through the inlet, it is heated by the generated energy and turned into warm air. Similarly, water is conducted through a zigzag pipe inside the container and heated to produce warm water.
Sample 11:
The diagrams illustrate how a solar panel is structured and how it is used.
Overall, the diagrams show the basic parts of a solar panel, through to the lower diagrams which illustrate how this panel functions to produce warm air or water.
Firstly, the top diagram illustrates the structural component parts of a simple solar panel. These parts are a sheet of transparent glass, which fits over the panel, an inlet pipe and an outlet pipe on the opposite side.
The second diagram, on the left, shows how the sun’s rays pass through the transparent glass, warming the air which enters the panel through the inlet pipe. The heated air then passes out of the panel through the outlet pipe. The final diagram shows how this same system functions to produce warm water. Water enters the solar panel through an inlet pipe, which then forms an ‘S’- shaped pipe in the panel itself. The water in this pipe is heated by the sun’s rays and exits the panel through the outlet.
Sample 12:
The diagrams depict the structure of a solar panel and its energy generation process.
Overall, the design of the solar panel is not complicated, comprising minimal details. This structure allows the panel to harness sunlight, heating either air or water.
In terms of its structure, the layout of the panel is straightforward, presenting a rectangular container featuring a transparent glass surface. Additionally, there are inlet and outlet openings situated on both sides of the container, which facilitates the flow of water and air through the system.
In terms of its function, energy generation operates through solar power utilization. Initially, sunlight is absorbed by the transparent glass, capturing its heat within the panel. This captured energy then transforms the flowing air within the system into warm air. Similarly, water contained within the system undergoes heating akin to the process involving air.
Sample 13:
The diagrams that are supplied show how a solar panel is built and utilized.
Overall, the system’s structure is quite simple, and its purpose is to use solar energy to heat either air or water.
In terms of the solar panel’s design, there is a container on either side with an input and an outlet. The inlet allows air and water to enter, while the outlet allows warm air or water to exit. To collect the sun’s rays, a sheet of transparent glass is put above the compartment.
Subsequently, the operation of a solar power system is depicted in the second two diagrams. The sun’s rays on the clear glass are absorbed and turned into energy at the start of the process. The created energy heats the air as it passes through the intake, converting it to warm air. Water is also heated and circulated via a patterned pipe inside the container to make warm water.
Hot: 1000+ Đề thi cuối kì 2 file word cấu trúc mới 2026 Toán, Văn, Anh... lớp 1-12 (chỉ từ 60k). Tải ngay
CÂU HỎI HOT CÙNG CHỦ ĐỀ
Lời giải

Sample 1:
The bar graph illustrates the overseas students' spending on accommodation, tuition, and living expenses, while the table depicts information about the average weekly expenses by international students in four countries: A, B, C, and D.
Overall, foreign students need to spend the highest in country A and the lowest in D. In nearly every nation, the international students’ weekly average living expenses are the greatest, while their housing cost registers the lowest.
The costliest country for studying is A, with a weekly average expense of 875 dollars. This is followed by B, C, and D, which have weekly expenses of 735, 540, and 435 dollars, respectively. However, foreign students always pay the least for accommodation, which incurs on average weekly 220, 280, 240, and 200 dollars in the nations A, B, C, and D, respectively.
On the other hand, living expenditures account for the highest portion of average weekly costs for international students in countries A, B, and C, with 430, 350, and 275 dollars, correspondingly. Tuition fees in the same countries (A, B and C) come in second with the weekly averages of 358, 320, and 250 dollars in order. However, D is the only nation where education accounts for the highest average spending area, coming in at USD 235, followed by the cost of living (USD 225) and housing (USD 200).
Sample 2:
The table illustrates information regarding the weekly spendings by overseas students in four countries, A, B, C and D, while the bar graph depicts the students’ expenditure on the sectors, housing, education fees and living expenses.
Overall, the cost of studying abroad is the highest in country A and the lowest in D. Apart from country D, living costs account for the most part of the weekly spendings in all countries, while accommodation registers the least.
Regarding the total cost of studying, A is the most expensive country with weekly average 875 dollars, followed by B, C and D with 735, 540 and 435 dollars, respectively. On the other hand, the overseas students always spend the least on accommodation, which are on average weekly 220, 280, 240 and 200 dollars in the corresponding countries A, B, C and D.
Considering the living cost, it takes the largest share of foreign students’ average weekly expenses in countries A, B, and C with 430, 350 and 275 dollars, respectively, while tuition fees in the same countries hold the second place with weekly average 358, 320 and 250 dollars, sequentially. However, D is the only country where tuition fee occupies the highest expenditure with average weekly 235 dollars, followed by living cost (USD 225) and accommodation (USD 200.)
Sample 3:
The table and bar graph depict information regarding the weekly spendings by overseas students in countries A, B C and D.
Overall, there are three elements, housing, school fees and living costs that contribute to the total weekly spendings. The total expenditure in country A is the highest while it is the lowest in country D. Living costs account for the most part of the weekly spendings in all countries except D.
The total mean weekly cost for pupils to study in country A is US$875, next by country B at US$735, and then by country C at US$540, and finally by country D at US$435. The living costs are always the biggest component of the expenditure except for country D, with about US$10 less than the major spending which is the school fees.
Accommodation accounts for the least among all spendings in all countries. The most expensive housing is found in country B, at US$280, and the cheapest in country D at US$200. The middle range can be seen in country A at US$220 and country C at US$240, respectively. Costs of the tuition fee range between US$ 358 and US$235 in country A and D, in order.
Lời giải

Sample 1:
The bar chart and pie chart give information about why US residents travelled and what travel problems they experienced in the year 2009.
It is clear that the principal reason why Americans travelled in 2009 was to commute to and from work. In the same year, the primary concern of Americans, with regard to the trips they made, was the cost of travelling.
Looking more closely at the bar chart, we can see that 49% of the trips made by Americans in 2009 were for the purpose of commuting. By contrast, only 6% of trips were visits to friends or relatives, and one in ten trips were for social or recreation reasons. Shopping was cited as the reason for 16% of all travel, while unspecific ‘personal reasons’ accounted for the remaining 19%.
According to the pie chart, price was the key consideration for 36% of American travellers. Almost one in five people cited safety as their foremost travel concern, while aggressive driving and highway congestion were the main issues for 17% and 14% of the travelling public. Finally, a total of 14% of those surveyed thought that access to public transport or space for pedestrians were the most important travel issues.
Sample 2:
The bar chart compares the figures for Americans going out for five reasons and the pie chart illustrates the percentage of six problems that concerned them when travelling in 2009. Overall, it is clear that the main reason why people in the US went out in 2009 is to commute to work, and the cost of travelling is the problem concerning them the most.
Looking first at the bar graph, the proportion of Americans going out for commuting to work stood at 49%, while the figure for those leaving their house for personal reasons accounted for 19%. In addition, the rate of people in the US going out for shopping and recreation made up 16% and 10%, respectively, while visiting friends or relatives accounted for the lowest percentage, at only 6%.
Turning to the pie chart, the cost of travelling was the most concerning problem of Americans when going out, with the figure making up 36%, while the proportion of safety concerns is half of that, at 19%. In addition, 17% of US citizens were concerned about aggressive drivers, while highway congestion made 14% of them worried when leaving their house. Access to public transportation and places for people to walk accounted for the lowest percentages, at only 8% and 6%, respectively.
Sample 3:
The provided charts offer insights into the reasons for travel and the primary concerns faced by the traveling public in the United States during the year 2009. The data is presented through a bar chart illustrating travel purposes and a pie chart highlighting key issues.
Notably, the primary motivation for travel among Americans in 2009 was commuting to and from work. Simultaneously, the major concern for the traveling public during their trips revolved around the cost associated with travel.
Examining the bar chart in detail reveals that almost half of the trips made by Americans in 2009, precisely 49%, were attributed to commuting. Conversely, visits to friends or relatives accounted for a mere 6%, while social or recreational trips constituted one in ten journeys. Shopping emerged as the purpose for 16% of all travel, leaving the remaining 19% for unspecific ‘personal reasons.’
Turning attention to the pie chart, it becomes evident that cost was the primary consideration for 36% of American travelers. Safety closely followed, with nearly one in five people, or 19%, expressing it as their foremost travel concern. Aggressive driving and highway congestion were significant issues for 17% and 14% of the traveling public, respectively. Additionally, 14% of respondents identified access to public transport or space for pedestrians as the most crucial travel issues.
Sample 4:
The bar chart shows why American people chose to travel, and the pie chart shows the main issues for the travelling public in the USA, both for 2009. The trend suggests that the reason and price were the main issues for travel in the United States. It is clear that commuting from work was reported as the biggest contribution to travel, at 49%. People who went travelling for personal reasons and shopping accounted for 35% when these two groups are combined. However, interaction with friends and relatives only accounted for 25% less than the above categories. And social and recreational activities took up only 6%, which was the lowest figure by more than 43%. The travelling public’s main issues were related to price and safety, with 55% of respondents reporting these two issues. While other issues accounted for a relatively small part. Only 17% of the respondents reported issues with aggressive drivers, while highway congestion accounted for even less at 14% of the issues reported. The percentage of access to public transport and space for pedestrians was much lower than the other categories at less than 10% for both. To conclude, price and commuting time were the dominant factors relating to travel in the US in 2009.
Lời giải
Bạn cần đăng ký gói VIP ( giá chỉ từ 250K ) để làm bài, xem đáp án và lời giải chi tiết không giới hạn.
Lời giải
Bạn cần đăng ký gói VIP ( giá chỉ từ 250K ) để làm bài, xem đáp án và lời giải chi tiết không giới hạn.
Lời giải
Bạn cần đăng ký gói VIP ( giá chỉ từ 250K ) để làm bài, xem đáp án và lời giải chi tiết không giới hạn.
Lời giải
Bạn cần đăng ký gói VIP ( giá chỉ từ 250K ) để làm bài, xem đáp án và lời giải chi tiết không giới hạn.
Lời giải
Bạn cần đăng ký gói VIP ( giá chỉ từ 250K ) để làm bài, xem đáp án và lời giải chi tiết không giới hạn.