


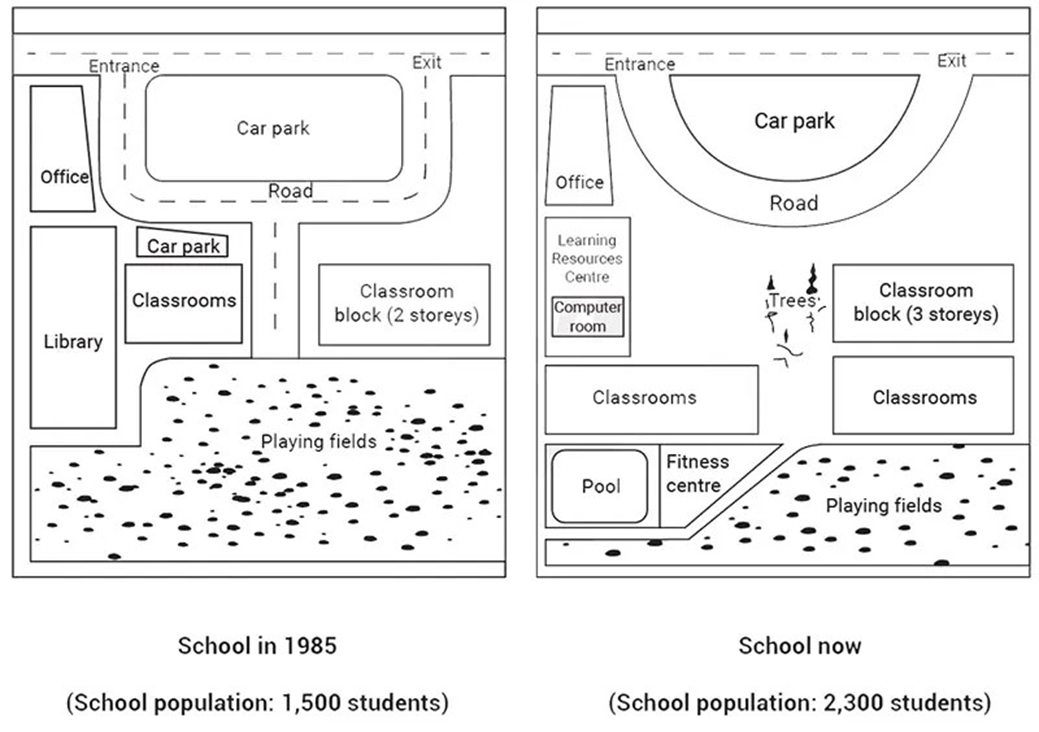
The map below shows a school in 1985 and the school now.
Summarise the information by selecting and reporting the main features, and make comparisons where relevant. Write at least 150 words.
The map below shows a school in 1985 and the school now.
Summarise the information by selecting and reporting the main features, and make comparisons where relevant. Write at least 150 words.
Câu hỏi trong đề: 2000 câu trắc nghiệm tổng hợp Tiếng Anh 2025 có đáp án !!
Quảng cáo
Trả lời:
Sample 1:
The two maps illustrate the degree to which a school campus has changed since 1985.
Overall, the school has experienced significant alterations to accommodate the growing number of students, the most prominent of which are additional classrooms and the construction of various sports and educational amenities. Further changes have also been made to the school’s access and parking facilities.
In 1985, the school had an enrollment of 1500 students. In the west of the campus, there was a cluster of facilities, including classrooms, a small parking lot, a library, and an office, while on the east side stood a block of classrooms with two storeys. The students accessed the campus through the entrance and exit points positioned on both sides of a large car park in the north, with a road branching off in the middle of the map, leading to spacious playing fields in the south.
At present, the student population has risen significantly to 2300. Whilst the office remains intact, the library has been reduced in size and become a new learning resources center housing a computer room, making way for the relocation of the now expanded classroom building. Just south of this is a newly built gymnasium with an indoor swimming pool, overtaking approximately half of the playing fields. Meanwhile, a third floor has been added to the classroom block, accompanied by more classrooms being built to its south. In the north, the small car park has been completely removed, and the rectangular one has been reshaped into a semicircle. Finally, a group of trees has been planted, replacing the road in the center of the campus.
Sample 2:
The map displays the different distribution of a school in 1985 and now. It is clear that the school changed dramatically during the period.
In 1985, there were 1500 people in this school, and it had a square car park and a road, which is located on the northern of the school. On the east part of the school, there was a classroom block which had 2 storeys. A large field was located in the south part of the school, and in the west part of the school, there are some of the buildings laid in here, which include office, library and car park.
At present, the population of this school increased to 2300. The north car park remains but its size is smaller. On the west part of the school, the new classrooms are constructed, and the classroom block adds the storeys by 3. The south field was cleared to make a way for pool and fitness centre. On the west part of the school, the car park was demolished, new classrooms were built in here, and the library change to a resource centre which has a computer room.
Overall, it is obvious that more and more facilities have been constructed in this school and many more students studying in this school.
Sample 3:
The maps illustrate the extent to which a school campus has transformed since 1985.
Overall, the school has witnessed significant changes, which include the incorporation of classrooms and other sports and educational facilities. Moreover, the parking lot has also seen significant changes.
In 1985, to accommodate 1500 students, there was an office, a library, and classrooms next to a small parking area in the west of the schools as opposed to only a 2-storey block of classrooms in the east. There was a huge car park in the north, which was surrounded by a road that connected the school’s entrance and exit in the northwest and northeast respectively. This road was access for students to reach huge playgrounds in the south of the school.
Considerable alterations have been witnessed to accommodate 2300 students now. In the west of the school, the library now becomes a new learning resources center where there is a computer room. The old classrooms have been relocated next to the new learning resources center. The playing fields have been reduced in size and roughly half of it has been the construction of a new sports area, which is also located to the south of the new classrooms, including a swimming pool and a fitness center. A third floor has been added to the 2-storey classroom block, next to more classrooms being built to the south of it. The small car park in the north of the school has been enlarged and the road connecting the entrance and exit has been reshaped into a more curved one. Moreover, many trees have been planted and replaced the road that led to the playing fields.
Sample 4:
The given diagrams compare the layout of a school in 1985 with its present-day one. Overall, the school has undergone many changes to accommodate the growing number of students over the given period of three decades.
After more than 30 years, the student population has grown from 1500 to 2300. In 1985, the entrance and exit were in the north, on the two sides of a rectangular car park. There was a playing field occupying a substantial area in the south, and a road running along the periphery of the car park connecting the entry and the exit. This road extended along the center to the playing area. An office was in the northwest of the road. To the south of the office, there was a library, which extended into the play area. Another smaller car park and some classrooms were there on the east of the office and library. A two-story classroom block was located towards the east of the road.
In the present layout, the rectangular car park has been replaced by a bigger, semi-circular car park. The road connecting the car park to the playing fields, and the smaller car park have been removed, while the entrance, exit, and office have remained unchanged. A learning resource center and a computer room have taken the place of the old library. The area of the playing fields has been cut down to make room for a pool and fitness center. Another story has been added to the two-story classroom block with some trees planted in the place of the road. Some more classrooms have been constructed to the south of the three-story classroom block.
Sample 5:
The two diagrams depict the extent of transformations a school campus has undergone since 1985.
Overall, the modifications to the school campus since 1985 have been extensive to accommodate the increase in the number of students, involving the expansion of classrooms, the establishment of new sports and educational facilities, adjustments to the parking facilities, and alterations to the campus's layout.
In the year 1985, the school's student population amounted to 1500. Students accessed the campus through entrance and exit points situated on both sides of a spacious and rectangular parking lot in the northern region. From here, a road led to expansive playing fields in the southern portion, west of which was a cluster of facilities including classrooms, a small parking lot, a library, and an administrative office. On the eastern side, there existed a two-story block of classrooms.
At present, there has been a substantial rise in the school’s enrollment, reaching a total of 2300 students. While the office remains unaltered, the small car park was demolished and the library has been transformed into a new learning resources center, encompassing a computer room. Additionally, the expanded classroom building has been relocated further south. Adjacent to this, a newly constructed gymnasium, featuring an indoor swimming pool, occupies approximately half of the previous playing fields. Regarding the eastern campus, the classroom block has been extended with the addition of a third floor, accompanied by the construction of more classrooms towards its southern end. In the northern area, the rectangular parking area has been reshaped into a semicircular configuration. Lastly, a cluster of trees has been planted, replacing the road that previously ran through the center of the campus.
Sample 6:
The maps illustrate the layout of a school in 1985 and how it looks currently. Overall, most changes involved the school's access and amenities, with some newly added and some resized. Notably, the number of students had increased quite significantly.
In the past, there were only a few facilities mainly for academic purposes, accommodating 1500 students. To the left, a large rectangular library, a small car park and several classrooms were grouped, with an office just above the library. Opposite these was a 2-storey block of classrooms. In terms of access, a vehicle road, which circulated another car park in the centre near the entrance and exit at the top, led to huge playing fields at the far bottom.
Today, the school has more facilities as the student figure has increased to 2300. The road now only surrounds the central car park, which was reduced in size. The office has remained the same; however, the smaller car park and nearby classrooms were demolished, while the old library was transformed into a resource learning centre with a computer room. However, the classroom building opposite has stayed in the same place, but it now has 3 floors. In contrast, the playing fields were made smaller, making room for 2 groups of new classrooms and a fitness centre with an indoor swimming pool in the lower left corner.
Sample 7:
The maps depict the transformation of a school campus from 1985 to the present, primarily driven by an increased student body.
Notable changes include expanded classroom spaces, updated sports and academic facilities, and modifications in access and parking arrangements.
In 1985, the campus accommodated 1500 students. Westward, facilities clustered, featuring classrooms, a small parking area, a library, and an office. Conversely, the east housed a two-story classroom block. Entrances were positioned on both sides of a large northern car park, with a road branching towards spacious southern playing fields.
By the present day, student enrollment has surged to 2300. The library has been downscaled to create a learning resources center, now hosting a computer room. Classrooms have expanded, a new gymnasium with a pool has replaced half the fields, and the classroom block now spans three floors. The smaller parking area is gone, the larger one reshaped, and a tree cluster replaces the central road. Overall, the campus transformation reflects a significant adaptation to accommodate increased student numbers and upgraded facilities.
Sample 8:
The map illustrates the layout of a school in 1985 and the present day.
Overall, the school has undergone significant changes to accommodate a larger number of students (from 1,500 to 2,300 students), with the most notable changes being the reduction in the size of the road and playing fields to make room for additional learning and sports facilities.
Looking first at the southern part of the campus, in 1985, it was mainly occupied by the playing fields. They are now half the size they used to be, with a new pool and a fitness centre built in the west and new classrooms constructed in the northeast corner. Just north of the new sports facilities now stand a new, larger classroom building, replacing the one that once lay next to the old library. The library itself has been repurposed into a new learning resources centre with a dedicated computer room.
Upon entering the school, in 1985, there were roads around the main rectangular car park and going south to the playing fields. The main car park has been redesigned into a semicircle, with corresponding changes to the road around it. The smaller car park located just south of this driveway, along with the road that led to the playing fields, has been removed. Another major change has taken place in the east of the campus, where the classroom block now has 3 storeys instead of 2, and a new green area has been introduced in place of the road.
Sample 9:
The accompanying diagrams delineate the transformation of a school from its original layout in 1985 to its current setup. It is evident from the illustrations that the campus has undergone substantial modifications, resulting in an enhanced, capacious environment.
Directing our attention to the northern half of the maps, one can observe the original rectangular car park has evolved into a semi-circular form, instigating a consequent metamorphosis of the surrounding thoroughfare. The office retains its initial position on the western flank, while the erstwhile library has been supplanted by a technologically equipped learning resources centre. Adjacent to the old library, the smaller car park and classrooms have been demolished, making way for expansion.
On the eastern periphery, the classroom block has been expanded vertically, with an additional storey augmenting the total to three levels. The heart of the campus is now adorned with a number of newly planted trees, infusing the area with greenery.
Shifting focus to the southern half, the playing fields have been curtailed to half their original size. On the western side, a new aquatic centre and a fitness facility complement the additional classrooms. Analogously, on the east, the diminished playing fields are flanked by fresh classrooms. Overall, the renovations and additions symbolize a transformative shift from the traditional school layout of 1985 to a more multifaceted and resourceful campus.
Sample 10:
The provided diagrams offer a comparative study of a school's infrastructure, contrasting its 1985 configuration with the present layout. An evaluation of the illustrations underscores significant evolution, transforming the school into an expansive and amenity-rich environment.
Scrutinizing the top half of the maps, one witnesses the transformation of the originally rectangular car park into a semi-circular layout, thereby altering the adjacent roadway. The administrative block remains constant on the western side, while the antiquated library gives way to a state-of-the-art learning resources center, replete with a computer room. The erstwhile smaller car park and adjacent classrooms, located next to the traditional library, have been razed to provide room for enhancements.
To the east, the school building has seen vertical expansion with the construction of an extra floor, resulting in a three-storey edifice. The heart of the campus is now adorned with freshly planted foliage, providing a lush green aesthetic to the area.
Observing the lower half, the playing fields have undergone a significant downsizing to half of their original expanse. The west side welcomes the addition of a swimming facility and a fitness center, supplementing the newly erected classrooms. Similarly, the east is home to newly built classrooms, abutting the shrunken playing fields. Overall, the transformation from a basic 1985 layout to a contemporary, amenity-rich environment embodies the school's progressive shift.
Sample 11:
The provided maps compare the layout of the school between 1985 and the present day.
Overall, the school has undergone significant transformations to accommodate the expansion in student capacity.
Notably, while the school has preserved the original locations of its entrance, exit, and administrative office, major infrastructural modifications have been implemented. The bigger car park, previously rectangular, has been reconfigured into a curved design. Additionally, the road leading to the playing fields has been eliminated, giving way to a landscaped green area enriched with trees.
Due to the substantial growth in the student population, which has risen by 800, the classroom block has been expanded vertically by adding an additional story. This expansion in the number of students has caused a reduction in the play area, with parts of this space now repurposed to house more classrooms and other essential facilities. In response to evolving educational priorities, the school has also introduced new amenities, including a swimming pool and a fitness center. Moreover, the traditional library has been transformed into a Learning Resources Centre and a Computer room, indicating a shift towards digital learning platforms and resources.
Sample 12:
The given map illustrates the changes in a school’s structure from 1985 to the present day. Overall, the school saw substantial development, with new constructions and adjustments to existing buildings and the student population rose evidently throughout the mentioned years.
To begin with, in 1985, the school comprised a square car park and a road situated to the north. Additionally, a two-storey classroom block occupied the eastern section of the campus. Meanwhile, the southern area featured a spacious field, while various buildings, including offices and a library, were positioned to the west.
In contrast, the present-day configuration of the school showcases significant modifications. Additionally, the northern car park has undergone a reduction in size, while new classrooms have been erected on the western side. Furthermore, the classroom block has expanded to three storeys, accommodating the increased student population. Additionally, the former field has been replaced with a pool and fitness centre, and the former western car park has been made into additional classrooms and a computer-equipped resource centre.
Sample 13:
The provided map compares the layout of a school in 1985 with its current structure and the changes over this time span have been significant. Overall, the school has undergone considerable development, with more facilities added and a steady increase in the student count.
Back in 1985, the school accommodated around 1500 students and had a square car park and a road leading to the playing fields, located on the north side. Moreover, a two-story classroom block was situated in the east, while various buildings, including classrooms, a library, and an office, were present on the west side.
Today, with a population of 2300, the school has seen significant alterations. While the northern car park remains, it has shrunk in size. The road connecting to the playing fields has disappeared, though the entrances and exits remain unchanged. New classrooms have been built in the east, and the classroom block has been extended to three floors. Additionally, the playing fields have been reduced in size to accommodate a fitness centre and a pool.
Hot: 1000+ Đề thi cuối kì 2 file word cấu trúc mới 2026 Toán, Văn, Anh... lớp 1-12 (chỉ từ 60k). Tải ngay
CÂU HỎI HOT CÙNG CHỦ ĐỀ
Lời giải

Sample 1:
The bar graph illustrates the overseas students' spending on accommodation, tuition, and living expenses, while the table depicts information about the average weekly expenses by international students in four countries: A, B, C, and D.
Overall, foreign students need to spend the highest in country A and the lowest in D. In nearly every nation, the international students’ weekly average living expenses are the greatest, while their housing cost registers the lowest.
The costliest country for studying is A, with a weekly average expense of 875 dollars. This is followed by B, C, and D, which have weekly expenses of 735, 540, and 435 dollars, respectively. However, foreign students always pay the least for accommodation, which incurs on average weekly 220, 280, 240, and 200 dollars in the nations A, B, C, and D, respectively.
On the other hand, living expenditures account for the highest portion of average weekly costs for international students in countries A, B, and C, with 430, 350, and 275 dollars, correspondingly. Tuition fees in the same countries (A, B and C) come in second with the weekly averages of 358, 320, and 250 dollars in order. However, D is the only nation where education accounts for the highest average spending area, coming in at USD 235, followed by the cost of living (USD 225) and housing (USD 200).
Sample 2:
The table illustrates information regarding the weekly spendings by overseas students in four countries, A, B, C and D, while the bar graph depicts the students’ expenditure on the sectors, housing, education fees and living expenses.
Overall, the cost of studying abroad is the highest in country A and the lowest in D. Apart from country D, living costs account for the most part of the weekly spendings in all countries, while accommodation registers the least.
Regarding the total cost of studying, A is the most expensive country with weekly average 875 dollars, followed by B, C and D with 735, 540 and 435 dollars, respectively. On the other hand, the overseas students always spend the least on accommodation, which are on average weekly 220, 280, 240 and 200 dollars in the corresponding countries A, B, C and D.
Considering the living cost, it takes the largest share of foreign students’ average weekly expenses in countries A, B, and C with 430, 350 and 275 dollars, respectively, while tuition fees in the same countries hold the second place with weekly average 358, 320 and 250 dollars, sequentially. However, D is the only country where tuition fee occupies the highest expenditure with average weekly 235 dollars, followed by living cost (USD 225) and accommodation (USD 200.)
Sample 3:
The table and bar graph depict information regarding the weekly spendings by overseas students in countries A, B C and D.
Overall, there are three elements, housing, school fees and living costs that contribute to the total weekly spendings. The total expenditure in country A is the highest while it is the lowest in country D. Living costs account for the most part of the weekly spendings in all countries except D.
The total mean weekly cost for pupils to study in country A is US$875, next by country B at US$735, and then by country C at US$540, and finally by country D at US$435. The living costs are always the biggest component of the expenditure except for country D, with about US$10 less than the major spending which is the school fees.
Accommodation accounts for the least among all spendings in all countries. The most expensive housing is found in country B, at US$280, and the cheapest in country D at US$200. The middle range can be seen in country A at US$220 and country C at US$240, respectively. Costs of the tuition fee range between US$ 358 and US$235 in country A and D, in order.
Lời giải

Sample 1:
The bar chart and pie chart give information about why US residents travelled and what travel problems they experienced in the year 2009.
It is clear that the principal reason why Americans travelled in 2009 was to commute to and from work. In the same year, the primary concern of Americans, with regard to the trips they made, was the cost of travelling.
Looking more closely at the bar chart, we can see that 49% of the trips made by Americans in 2009 were for the purpose of commuting. By contrast, only 6% of trips were visits to friends or relatives, and one in ten trips were for social or recreation reasons. Shopping was cited as the reason for 16% of all travel, while unspecific ‘personal reasons’ accounted for the remaining 19%.
According to the pie chart, price was the key consideration for 36% of American travellers. Almost one in five people cited safety as their foremost travel concern, while aggressive driving and highway congestion were the main issues for 17% and 14% of the travelling public. Finally, a total of 14% of those surveyed thought that access to public transport or space for pedestrians were the most important travel issues.
Sample 2:
The bar chart compares the figures for Americans going out for five reasons and the pie chart illustrates the percentage of six problems that concerned them when travelling in 2009. Overall, it is clear that the main reason why people in the US went out in 2009 is to commute to work, and the cost of travelling is the problem concerning them the most.
Looking first at the bar graph, the proportion of Americans going out for commuting to work stood at 49%, while the figure for those leaving their house for personal reasons accounted for 19%. In addition, the rate of people in the US going out for shopping and recreation made up 16% and 10%, respectively, while visiting friends or relatives accounted for the lowest percentage, at only 6%.
Turning to the pie chart, the cost of travelling was the most concerning problem of Americans when going out, with the figure making up 36%, while the proportion of safety concerns is half of that, at 19%. In addition, 17% of US citizens were concerned about aggressive drivers, while highway congestion made 14% of them worried when leaving their house. Access to public transportation and places for people to walk accounted for the lowest percentages, at only 8% and 6%, respectively.
Sample 3:
The provided charts offer insights into the reasons for travel and the primary concerns faced by the traveling public in the United States during the year 2009. The data is presented through a bar chart illustrating travel purposes and a pie chart highlighting key issues.
Notably, the primary motivation for travel among Americans in 2009 was commuting to and from work. Simultaneously, the major concern for the traveling public during their trips revolved around the cost associated with travel.
Examining the bar chart in detail reveals that almost half of the trips made by Americans in 2009, precisely 49%, were attributed to commuting. Conversely, visits to friends or relatives accounted for a mere 6%, while social or recreational trips constituted one in ten journeys. Shopping emerged as the purpose for 16% of all travel, leaving the remaining 19% for unspecific ‘personal reasons.’
Turning attention to the pie chart, it becomes evident that cost was the primary consideration for 36% of American travelers. Safety closely followed, with nearly one in five people, or 19%, expressing it as their foremost travel concern. Aggressive driving and highway congestion were significant issues for 17% and 14% of the traveling public, respectively. Additionally, 14% of respondents identified access to public transport or space for pedestrians as the most crucial travel issues.
Sample 4:
The bar chart shows why American people chose to travel, and the pie chart shows the main issues for the travelling public in the USA, both for 2009. The trend suggests that the reason and price were the main issues for travel in the United States. It is clear that commuting from work was reported as the biggest contribution to travel, at 49%. People who went travelling for personal reasons and shopping accounted for 35% when these two groups are combined. However, interaction with friends and relatives only accounted for 25% less than the above categories. And social and recreational activities took up only 6%, which was the lowest figure by more than 43%. The travelling public’s main issues were related to price and safety, with 55% of respondents reporting these two issues. While other issues accounted for a relatively small part. Only 17% of the respondents reported issues with aggressive drivers, while highway congestion accounted for even less at 14% of the issues reported. The percentage of access to public transport and space for pedestrians was much lower than the other categories at less than 10% for both. To conclude, price and commuting time were the dominant factors relating to travel in the US in 2009.
Lời giải
Bạn cần đăng ký gói VIP ( giá chỉ từ 250K ) để làm bài, xem đáp án và lời giải chi tiết không giới hạn.
Lời giải
Bạn cần đăng ký gói VIP ( giá chỉ từ 250K ) để làm bài, xem đáp án và lời giải chi tiết không giới hạn.
Lời giải
Bạn cần đăng ký gói VIP ( giá chỉ từ 250K ) để làm bài, xem đáp án và lời giải chi tiết không giới hạn.
Lời giải
Bạn cần đăng ký gói VIP ( giá chỉ từ 250K ) để làm bài, xem đáp án và lời giải chi tiết không giới hạn.
Lời giải
Bạn cần đăng ký gói VIP ( giá chỉ từ 250K ) để làm bài, xem đáp án và lời giải chi tiết không giới hạn.