


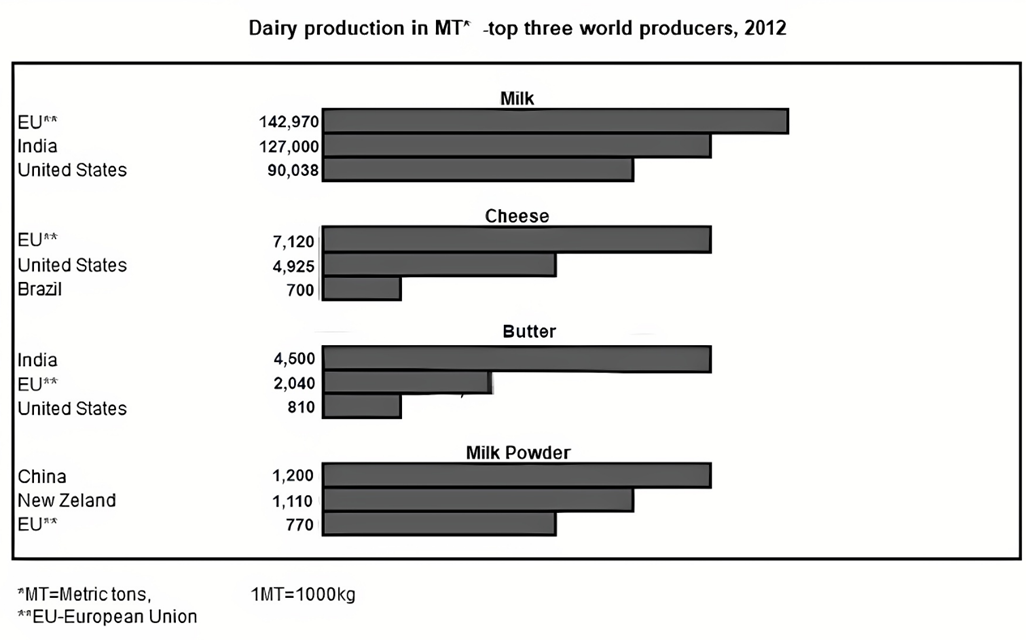
The charts below give information about the world's top three producers for four dairy products (milk, cheese, butter, milk powder) in the year of 2012.
Summarise the information by selecting and reporting the main features, and make comparisons where relevant. Write at least 150 words.
The charts below give information about the world's top three producers for four dairy products (milk, cheese, butter, milk powder) in the year of 2012.
Summarise the information by selecting and reporting the main features, and make comparisons where relevant. Write at least 150 words.
Câu hỏi trong đề: 2000 câu trắc nghiệm tổng hợp Tiếng Anh 2025 có đáp án !!
Quảng cáo
Trả lời:
Sample 1:
The bar graphs detail the output of leading three manufacturers globally for four various dairy items in 2012. Overall, the total production of milk from the three key contributors was significantly higher than the other consumables, followed by cheese, butter and milk powder. Moreover, while the European Union dominated in the quantity of milk and cheese produced, it ranked last in the manufacturing of powdered milk.
Concerning the categories in which the European Union produced the highest amount, it made nearly 143,000 metric tonnes of milk and about 7,100 metric tonnes of cheese. Furthermore, the amount of milk manufactured by India was 127,000 compared to roughly 90,000 metric tonnes made in America. Meanwhile, America and Brazil yielded 4,925 and 700 metric tonnes of cheese, respectively.
Regarding the other dairy staples, the most productive area for butter was India, at 4,500 metric tonnes, followed by the European Union and the United States, at approximately 2,000 and 810 metric tonnes, respectively. Finally, in terms of milk formula, China and New Zealand had a relatively identical amount of nearly 1,200 metric tonnes each, which was around 400 metric tonnes higher than the European Union.
Sample 2:
The bar charts compare the production quantities of various dairy products by the world's top producers in 2012.
The European Union consistently emerged as a leading producer across all categories, except for milk powder.
The production of milk was highest in the European Union, at 142,970 metric tons, followed by India and the United States, with 127,000 and 90,038 metric tons respectively. In cheese production, while the European Union again led with 7,120 metric tons, the United States followed with a significant amount of 4,925 metric tons, overshadowing Brazil's production of 700 metric tons.
Regarding butter, a reversal in the leading position was observed with India surpassing the European Union, producing 4,500 metric tons compared to the latter's 2,040 metric tons. The United States trailed behind with 810 metric tons. In the milk powder sector, China outstripped other producers with 1,200 metric tons, closely followed by New Zealand and the European Union, which produced 1,110 and 770 metric tons respectively.
Sample 3:
The bar chart presents data on the dairy production of milk, cheese, butter, and milk powder by the top three producers in 2012, with quantities measured in metric tonnes.
Overall, the European Union emerged as the predominant producer in the realms of milk and cheese, whereas India and China respectively secured the top spots in the production of butter and milk powder.
In milk production, the EU’s output reached 142,970 metric tonnes, constituting a notable 40% of the total production by the three leaders, surpassing India by approximately 15,000 metric tonnes and the United States by over 50,000 metric tonnes. Cheese production mirrored this trend, with the EU producing 7,120 metric tonnes, more than half the combined output of the next two largest producers.
Conversely, India dominated butter production, yielding 4,500 metric tonnes, a figure more than double that of the EU’s and substantially higher than the United States’ production of 810 metric tonnes. The production of milk powder showcased a different leader, with China at the forefront with 1,200 metric tonnes, marginally exceeding New Zealand’s production and significantly outstripping the EU’s output of 770 metric tonnes.
Sample 4:
The bar chart in question delineates the production quotas of the foremost global dairy suppliers, categorising their outputs into four dairy segments: milk, cheese, butter, and milk powder for the year 2012. An analytical scrutiny of the data indicates a marked dominance by the European Union (EU), India, and the United States in the dairy production hierarchy.
In the realm of milk and cheese, the EU's production was unparalleled, with their dairy farms yielding 142,970 MT of milk and 7,120 MT of cheese, positioning them at the zenith of European dairy commerce. India was a formidable contender, securing the second rank in milk production at 127,000 MT, surpassing the United States by a significant margin of approximately 36,000 MT. The United States, however, manifested its dairy prowess in cheese production, generating 4,925 MT, a figure seven times higher than Brazil's contribution.
Transitioning to the realm of butter and milk powder, India's butter production reigned supreme, boasting a production volume of 4,500 MT, which more than doubled the EU's 2,040 MT and significantly overshadowed the United States' 810 MT. As for milk powder, China commanded the lead with a production of 1,200 MT, narrowly edging out New Zealand's commendable 1,110 MT and markedly outproducing the EU's 770 MT.
Sample 5:
The bar chart provides a detailed illustration of information about the world’s top three producers of four different dairy products in 2012, encompassing milk, cheese, butter, and milk powder. This data highlights the production capacity of the European Union (EU), India, and the United States in these categories.
Overall, the EU was the market leader in milk and cheese production while India and China we the largest manufacturers of butter and milk powder, respectively.
In the arena of milk and cheese, the EU's prodigious output was unmatched. It produced 142,970 metric tons (MT) of milk and 7,120 MT of cheese, positions that underscored its supremacy in these segments. India emerged as the second most prolific milk producer, with its production totaling 127,000 MT, which was substantially more than the United States by 36,000 MT. In the cheese category, the United States demonstrated its strength by producing 4,925 MT, a volume significantly higher than Brazil's, being almost seven times greater.
In the sphere of butter and milk powder, leadership roles shifted. India's butter production took center stage with a remarkable 4,500 MT, surpassing both the EU's 2,040 MT and the United States' 810 MT. Conversely, China dominated in milk powder production with a yield of 1,200 MT, marginally outperforming New Zealand's 1,110 MT and considerably exceeding the EU's production of 770 MT.
Sample 6:
The provided bar chart meticulously details the output of the world's top three producers of four different dairy products in 2012, measured in metric tonnes. A discernible pattern emerges, with the European Union (EU) taking the forefront in milk and cheese sectors, while India and China command the lead in butter and milk powder production, respectively.
For milk, the EU's production was unparalleled, registering at 142,970 metric tonnes, which underscores its role as a dairy powerhouse, outstripping India's robust yield by 15,000 metric tonnes and the US contribution by a considerable margin. Cheese production tells a similar story, with the EU producing a substantial 7,120 metric tonnes, dwarfing its competitors and accounting for over half of the total output among the top producers.
India’s predominance in butter production was marked, delivering an impressive 4,500 metric tonnes, more than quintupling the EU’s output, and eclipsing the United States' figure significantly. In the realm of milk powder, China edged into the lead with 1,200 metric tonnes, closely followed by New Zealand, leaving the EU trailing with 770 metric tonnes.
Sample 7:
The bar charts delineate the top three countries by dairy production in the year 2012. Overall, it can be seen that the European Union was the only region featured in all categories, and milk output far outweighed that of other products.
In the chart for milk production, the European Union exhibited an aggregate of nearly 143,000 metric tons in 2012, surpassing India's production by approximately 16,000 metric tons. Ranked third was the United States with a milk yield of just 90,038 metric tons. Although cheese’s output was nowhere near as prolific as milk’s, it was the second most produced dairy. The European Union retained its role as the leader in this category, boasting an outcome of 7,120 metric tons. The United States followed suit with approximately 5,000 metric tons, seven times the figure for Brazil.
With an output of 4,500 metric tons, India was the foremost contributor to the world’s butter production, which was more than double the European Union’s output. The United States claimed the third position with 810 metric tons. In comparison, milk powder production in the surveyed countries hovered around 1,000 metric tons, with China and New Zealand occupying the first and second place, respectively. Meanwhile, the third place belonged to the European Union, with 770 metric tons.
Sample 8:
The bar chart illustrates the four dairy production outputs of the top three producers in 2012.
Overall, milk stood out as the most significant, whereas milk powder occupied the position of the least produced in the market. Moreover, the European Union emerged as the global leader in producing milk-based products.
Regarding the global dairy industry, the European Union (EU) dominated milk products, recording a remarkable 142,970 MT. Subsequently, India secured the second-highest rank, contributing significantly with 127,000 MT, while the United States trailed with just over 90,000 MT. In the milk powder section, the EU yielded a quantity of 770 MT, yet the primary contributors in this category are China and New Zealand, with a substantial 1,200 MT and 1,100 MT, respectively.
When it comes to cheese, the European Union (EU) surpassed competitors, providing 7,120 MT, outclassing both the United States, which provided 4,925 MT, and Brazil, contributing 700 MT. Conversely, the amount of butter made by the EU was approximately 2,000 MT. India distinguished itself by supplying 4,500 MT, showcasing its more significant role in dairy goods.
Sample 9:
The charts demonstrate the three leading producers for four types of dairy products worldwide in 2012. Overall, a larger amount of milk was produced compared to other products. Additionally, while the European Union made the most milk and cheese, India was the top manufacturer of butter and China dominated milk powder production.
With regard to milk and cheese production, in the European Union the former stood at 142,970 metric tons, compared to 127,000 metric tons in India and 90,038 metric tons in the United States. In the same year, the European Union produced 7,120 metric tons of cheese, followed by 4,925 metric tons in the United States, and Brazil was far behind with only 700 metric tons.
Concerning the remaining products, butter production in India was recorded at 4,500 metric tons, more than double the figure for the European Union with 2,040 metric tons. However, just 810 metric tons of butter was made in the United States. Such a discrepancy was not seen in milk powder as the data for China and New Zealand were relatively comparable at 1,200 and 1,110 metric tons respectively, whilst the European Union manufactured 770 metric tons of milk powder.
Sample 10:
The bar chart compares the dairy production among the world's top three producers for the year 2012.
It is clear that in all the three regions, more milk was produced than other types of products. European Union was the primary producer of milk and cheese, while India and China took precedence in butter and milk powder production respectively.
In terms of milk output, EU took the lead with a substantial production of 142,970 metric tons, significantly surpassing the production in India by roughly 16,000 metric tons and that in US by around 50,000 metric tonnes. Likewise, EU still maintained its leading position in cheese production (7,120 metric tons), while Brazil only produced 700 metric tons of cheese.
However, with an output of 4,500 metric tons, India dominated butter production, a figure more than twice of the combined production in EU and US. A different pattern could be found in the production of milk powder. China ranked the top in this item (1,200 metric tons), closely followed by the figure in New Zealand (1,110 metric tons). The third largest producer was the EU, with 770 metric tons of milk powder produced in this area.
Sample 11:
The bar chart compares three leading countries on a worldwide scale in terms of their production of four types of dairy products, namely milk, cheese, butter and milk powder in the year 2012. The unit of measurement is metric tons (MT).
Overall, a similar pattern could be seen in all of the three major world producers, with the EU consistently being the primary manufacturer of four kinds of dairy products, followed by India and the United States (US). In addition, among the four categories, milk was by far the most commonly produced one, significantly surpassing the figures for milk powder.
The EU was the dominant producer of milk, manufacturing slightly under 150000 MT, and this was followed closely by India, whose production of the same product was approximately 130000 MT. By contrast, the US lags behind, having the least amount of milk produced (around 90000 MT). Milk powder almost exactly followed a similar pattern to that of milk, albeit at a far lower rate. The majority of this type of product was made in the EU (marginally below 1250 MT), whereas India and the US produced lower quantities, with respective figures being roughly 1100 MT and just over 750 MT.
Regarding butter, a considerable difference of about 2500 MT was witnessed in butter production, with the EU far outnumbering its Indian counterparts. While the former produced nearly 4500 MT, the figure for the latter was only 2000 MT. India produced nearly twice as much butter as the US, with the data for the US standing at a mere 800 MT. Finally, about 7000 MT of cheese was produced in the EU, as opposed to India, which accounted for close to two-thirds of the EU’s amount, at 5000MT. Notably, the lowest recorded figure occurred in cheese production in the US, where as low as 500 MT of this product was manufactured.
Sample 12:
The charts provide data about the production of milk, cheese, butter and milk powder by the highest world producers in 2012.
Overall, the European Union (EU) led the way in milk and cheese production. In terms of metric tons, the production of milk far exceeded that of the other dairy products.
The EU produced almost 143,000 metric tons of milk, compared with 127,000 metric tons in India and around 90,000 metric tons in the USA. The production of cheese in the EU was just over 7,000 metric tons, while the USA produced almost 5,000 metric tons and Brazil produced 700 metric tons.
India led world production of butter with 4,500 metric tons, more than double the figure for the EU, with production in the USA totalling just over 800 metric tons. Finally, China produced 1,200 metric tons of milk powder, a slightly higher figure than in New Zealand and the EU, with 1,110 and 770 metric tons, respectively.
Hot: 1000+ Đề thi cuối kì 2 file word cấu trúc mới 2026 Toán, Văn, Anh... lớp 1-12 (chỉ từ 60k). Tải ngay
CÂU HỎI HOT CÙNG CHỦ ĐỀ
Lời giải
Sample 1:
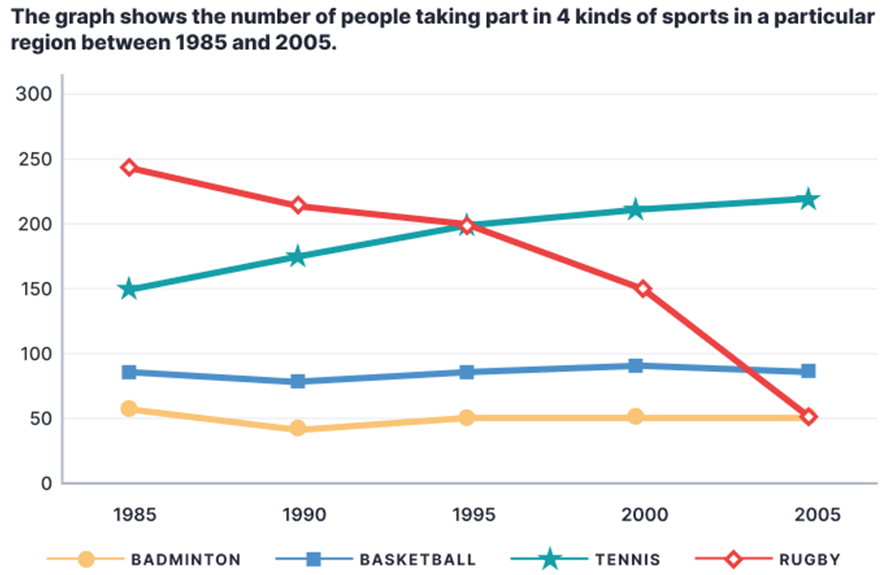
The line chart illustrates how many people participated in 4 distinct types of sports in a particular area from 1985 to 2005.
Overall, rugby was the most popular sport in the first half of the period while tennis took the lead in the second half. In addition, rugby saw a downward trend while tennis took the opposite direction; moreover, the trends for basketball and badminton were relatively stable.
In 1995, the number of people playing rugby stood at just under 250, surpassing the figure for tennis players by around 100. Basketball and badminton had comparatively lower participation rates, with around 80 and 50 participants in turn.
Afterwards, the number of people participating in rugby plunged, hitting a low of 50 in 2005, equal to the figure for badminton in the same year. In contrast, the trend for tennis was upward, with its participation rate increasing to roughly 220 people at the end of the period, establishing it as the leading sport. Finally, the figures for basketball and badminton underwent negligible changes, hovering around 80 and 50 participants respectively.
Sample 2:
The line graph illustrates how many people participated in four types of sports in a specific area from 1985 to 2005. Overall, there was a significant decrease in the number of people playing rugby in this region, whereas tennis showed a gradual upward trend to become the most popular sport in the second half of the period. Additionally, throughout the period, the trends for basketball and badminton were relatively stable and comparable, with the latter sport remaining the least common.
In the first decade, rugby had the highest number of players, despite witnessing a steady fall from nearly 250 to exactly 200 participants. From 1995 onwards, this sport kept losing popularity as its figure plummeted, reaching parity with badminton (at 50 people) in the final year.
In contrast, tennis was gaining popularity and had become the dominant category by the end of the timeframe. Specifically, starting at the second highest (at 150), the number of people engaging in tennis rose continually, overtaking that of rugby in 1995 before ending at approximately 250 players.
Meanwhile, roughly 80 people played basketball initially, after which it stayed virtually unchanged until the end of the period. Badminton almost exactly mirrored this trend, albeit at a lower rate, consistently hovering around the 50 mark.
Sample 3:
The line chart compares the number of participants in basketball, tennis, badminton and rugby over a 20-year period from 1985 in a specific area.
Overall, more people played tennis throughout the period, and it was the most common sport since 1995, while rugby's popularity declined. Notably, basketball and badminton mostly had stable numbers of players.
In terms of tennis and rugby, both sports indicated inverted trends. Although rugby started at the highest point with nearly 250 players, the figure declined continually to about 200 players in 1995, when this sport was no longer the most popular. Since then, the number of people playing rugby dropped more steeply, reaching 50 in 2005. In contrast, from 1985 onwards, the figure for tennis increased steadily from second place with 150 participants. By 2005, it had reached its highest point of roughly 220 players.
In comparison, there were far fewer people who took up basketball and badminton. However, these sports remained relatively stable, with basketball having about 70 participants every year, while badminton was always the least popular with approximately 50 players each year.
Sample 4:
The line graph provides information about the number of individuals engaging in four types of sports in a specific area from 1985 to 2005.
Overall, while tennis underwent a surge in popularity, rugby experienced a decrease in participation within this region over time, with basketball and badminton remaining relatively stable. Moreover, the most drastic shift in popularity was witnessed in rugby.
At the start of the period, in 1985, rugby was the most played sport, with 240 individuals participating, and it significantly outnumbered the next sport, tennis, which had only 150 participants. Thereafter, the number of people playing rugby dropped to 200 in 1995, before plummeting to a 20-year low of 50 in the final year. This stood in stark contrast to the rise in the popularity of tennis, which saw a steady increase in participants to a peak of about 220 in 2005, making it by far the most played sport at the end of the period.
Turning to the remaining sports, in the first year, 80 individuals played basketball, almost 25 more than badminton. Over the following decade, the participant numbers for basketball rose to about 90, while those for badminton dropped to a low of 45 in 1995. In the remaining period, these two sports maintained their popularity, as the numbers participating stayed at roughly the same level until 2005.
Sample 5:
The line chart delineates the participation levels in four distinct sports in a specific area from 1985 to 2005.
Primarily, rugby emerged as the most favored sport in the initial half of the period, while tennis took precedence in the latter half. Moreover, rugby exhibited a declining trend, whereas tennis experienced a converse trajectory. Meanwhile, the engagement rates for basketball and badminton remained relatively consistent.
In 1985, the number of rugby participants stood at just below 250, exceeding the tennis players by approximately 150 individuals. Simultaneously, basketball and badminton showcased lower participation rates, with around 80 and 50 individuals involved in each sport, respectively.
Subsequently, rugby participation plummeted significantly, reaching a nadir of 50 participants in 2005, akin to the number engaged in badminton during the same year. Conversely, tennis experienced an upward trend, escalating to nearly 220 individuals by the conclusion of the period, solidifying its status as the predominant sport. In contrast, the figures for basketball and badminton remained relatively stable, with approximately 80 and 50 participants, respectively, throughout the entire duration.
Sample 6:
The given line graph delineates the participation levels in 4 different sports, namely basketball, tennis, badminton, and rugby within a specific region over a span of 20 years.
Overall, it is evident that the number of individuals participating in tennis witnessed a consistent and notable increase, contrasting sharply with the downward trend observed in rugby participation. Meanwhile, while basketball and badminton recorded lower participation rates compared to other sports, they remained relatively stable throughout the entire period.
Turning to the number of tennis players, the figures began at a relatively moderate level of 150 individuals in 1985. Subsequently, it experienced a gradual and consistent increase in participation, reaching a pinnacle of nearly 230 participants by 2005. In stark contrast, the trend of rugby involvement presented a distinctive pattern. Commencing at a relatively high level of almost 240 people, the numbers steadily declined over time and by the end of the 20-year period, rugby participants had dwindled to 50, matching the level of engagement observed in badminton. Interestingly, a point of convergence occurred in 1995, where both tennis and rugby shared a similar number of participants, with approximately 200 individuals engaging in each sport.
In regard to the remaining sports participants, the numbers for both badminton and basketball remained relatively stable over the given time frame. Beginning with approximately 50 individuals engaging in badminton and around 80 individuals involved in basketball in 1985, these figures persisted with little variation until 2005. Consequently, by the end of the period, both sports witnessed a culmination with nearly the same number of participants as they had at the beginning.
Lời giải
Sample 1:
Many young people work on a voluntary basis, and this can only be beneficial for both the individual and society as a whole. However, I do not agree that we should therefore force all teenagers to do unpaid work.
Most young people are already under enough pressure with their studies, without being given the added responsibility of working in their spare time. School is just as demanding as a full-time job, and teachers expect their students to do homework and exam revision on top of attending lessons every day. When young people do have some free time, we should encourage them to enjoy it with their friends or to spend it doing sports and other leisure activities. They have many years of work ahead of them when they finish their studies.
At the same time, I do not believe that society has anything to gain from obliging young people to do unpaid work. In fact, I would argue that it goes against the values of a free and fair society to force a group of people to do something against their will. Doing this can only lead to resentment amongst young people, who would feel that they were being used, and parents, who would not want to be told how to raise their children. Currently, nobody is forced to volunteer, and this is surely the best system.
In conclusion, teenagers may choose to work for free and help others, but in my opinion, we should not make this compulsory.
Sample 2:
Some individuals nowadays feel that youngsters should accomplish unpaid volunteer work in their leisure time for the benefit of society. I completely believe that it is critical to involve children in volunteer activity. The primary issues will be discussed with examples in this essay.
To begin with, teenagers who participate in unpaid employment are more responsible for local society. When adolescents interact with other individuals, they become aware of the issues that people face daily, such as poverty, pollution, and others. Furthermore, we have all been affected by the present COVID-19 outbreak, and many people have suffered a loss. According to "The Voice of Vietnam - VOV” a volunteer who is anti-virus and empathizes with the mental pain that the patients are experiencing, he always gives oxygen and food to those who need it the most. As a result, volunteering helps students become the most responsible citizens in the country.
Furthermore, unpaid employment can assist youngsters in broadening their social contacts and developing soft skills. Because when they work in an unpaid job, they will meet a variety of individuals and acquire a range of skills and abilities from others, such as leadership, teamwork, communication, and dealing with challenging situations. For example, a recent study in Japan discovered that students who participate in volunteer work are more sociable, enthusiastic, and tolerant of others. They will grow more extroverted, energetic, and hard-working as compared to youngsters who do not perform unpaid employment.
To conclude, I feel that rather than paying, young people should perform unpaid social work because they can acquire many important skills and are more responsible to society.
Sample 3:
There is a growing debate about whether all adolescents should be asked to perform mandatory volunteer work in their leisure time to help assist the surrounding area. Although there are a variety of benefits associated with this topic, there are also some notable drawbacks, as will now be discussed.
The advantages of teenagers doing voluntary work are self-evident. The first relevant idea is work experience. A valid illustration of this would be to increase their tangible skills. For example, an adolescent who volunteers to help in a customer service department will learn how to communicate effectively with people in different age groups. On a psychological level, the youth’s life skills will also be enhanced by having empathy towards others. This can be demonstrated by volunteering and assisting families living in low socio-economic backgrounds with their day-to-day tasks.
There are, however, also drawbacks that need to be considered. On an intellectual level, the teenager may get distracted from their study. This situation, for instance, can be seen when voluntary work is also being undertaken during school terms. There would be time constraints for both areas. On a physiological level, youth might experience fatigue as they are unaware of the acceptable working or volunteering hours and, as a result, sometimes they can be overworked.
In summary, we can see that this is clearly a complex issue as there are significant advantages and disadvantages. I personally believe that it would be better not to encourage the youths to do compulsory work because their studies might take them to a higher level in society, whereas volunteering could restrict this progress.
Sample 4:
Children are the backbone of every country. So, there are people who tend to believe that youngsters should be encouraged to initiate social work as it will result in flourished society and individualistic growth of youngsters themselves. I, too, believe that this motivation has more benefits than its drawbacks.
To begin with, social work by children can be easily associated with personality development because, during this drive, they tend to communicate with the variety of people, which leads to polished verbal skills. For example, if they start convincing rural people to send their children to school, they have to adopt a convincing attitude along with developed verbal skills to deal with the diverse kinds of people they encounter. This improved skill will help them lifelong in every arena. Apart from this, the true values of life like tolerance, patience, team spirit, and cooperation can be learned. Besides that, young minds serve the country with full enthusiasm that gives the feeling of fulfillment and self-satisfaction. This sense of worthiness boosts their self-confidence and patriotic feelings. Moreover, experiencing multiple cultures and traditions broadens their horizons and adds another feather to their cap.
However, it is truly said, no rose without thrones. Can the drawbacks of this initiation be ignored? Children go to school, participate in different curriculum activities, endure the pressure of peers, parents, and teachers and in the competitive world, they should not be expected to serve society without their self-benefits. This kind of pressure might bring resentment in their mind.
In conclusion, I believe, the notion of a teenager doing unpaid work is indeed good but proper monitoring and care should be given to avoid untoward consequences.
Sample 5:
Youngsters are the building blocks of the nation and they play an important role in serving society because at this age they are full of energy not only mentally but physically also. Some people think that the youth should do some voluntary work for society in their free time, and it would be beneficial for both of them. I agree with the statement. It has numerous benefits which will be discussed in the upcoming paragraphs.
To begin with, they could do a lot of activities and make their spare time fruitful. First of all, they can teach children to live in slum areas because they are unable to afford education in schools or colleges. As a result, they will become civilized individuals and do not indulge in antisocial activities. By doing this they could gain a lot of experience and become responsible towards society. It would be beneficial in their future perspective.
In addition to this, they learn a sense of cooperation and sharing with other people of the society. for instance, they could grow plants and trees at public places, and this would be helpful not only to make the surrounding clean and green but reduce the pollution also to great extent. Moreover, they could arrange awareness programmes in society and set an example among the natives of the state. This will make the social bonding strong between the individuals and this will also enhance their social skills.
In conclusion, they can “kill two birds with one stone” because it has a great advantage both for the society and for the adolescents. Both the parents, as well as teachers, should encourage the teens to take part in the activities of serving the community in their free time.
Lời giải
Bạn cần đăng ký gói VIP ( giá chỉ từ 250K ) để làm bài, xem đáp án và lời giải chi tiết không giới hạn.
Lời giải
Bạn cần đăng ký gói VIP ( giá chỉ từ 250K ) để làm bài, xem đáp án và lời giải chi tiết không giới hạn.
Lời giải
Bạn cần đăng ký gói VIP ( giá chỉ từ 250K ) để làm bài, xem đáp án và lời giải chi tiết không giới hạn.
Lời giải
Bạn cần đăng ký gói VIP ( giá chỉ từ 250K ) để làm bài, xem đáp án và lời giải chi tiết không giới hạn.
Lời giải
Bạn cần đăng ký gói VIP ( giá chỉ từ 250K ) để làm bài, xem đáp án và lời giải chi tiết không giới hạn.