


The first graph shows the number of train passengers from 2000 to 2009; the second compares the percentage of trains running on time and target in the period.
Summarise the information by selecting and reporting the main features, and make comparisons where relevant. Write at least 150 words.
The first graph shows the number of train passengers from 2000 to 2009; the second compares the percentage of trains running on time and target in the period.
Summarise the information by selecting and reporting the main features, and make comparisons where relevant. Write at least 150 words.
Câu hỏi trong đề: 2000 câu trắc nghiệm tổng hợp Tiếng Anh 2025 có đáp án !!
Quảng cáo
Trả lời:
Sample 1:
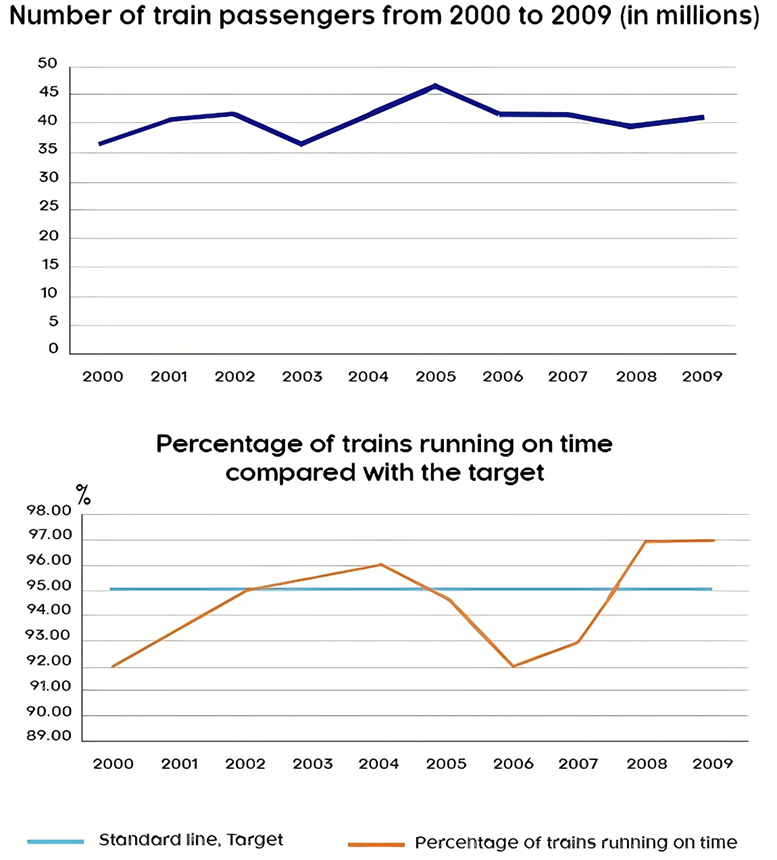
The upper line graph details how many passengers commuted by train whilst the lower one compares the proportion of trains operating on time with a fixed target of 95%. The statistics were recorded in an unspecified location over a 9-year period starting from 2000 to 2009.
The initial impression from the graph is that despite following an erratic trend over the years, the figure for train passengers saw an overall increase. In addition, acknowledging the presence of a baseline at 95%, the percentage of train running punctually achieved and exceeded the target from 2002 to 2004 and again from 2008 to 2009.
With respect to the first graph, starting off at around 36 million in 2000, the number of passengers experienced a short-term increase of 5 million in 2002 prior to a pullback to its original value in 2003. This figure was then fluctuating in an upward trajectory with a peak of 47 million in 2007 before declining and finishing at around 42 million at the end of the time frame.
A glance at the second graph shows that only 92% of trains ran on time back in 2000, and the situation was improved in 2002 onwards when the figure for actual on-time trains matched the expected 95% standard line and even exceeded it at 96% in 2004. However, this did not last long as this proportion dramatically fell short of target to a trough of 92% in 2006 before gathering pace to recover and reach the highest point of 97% in 2008 and 2009.
Sample 2:
The line charts illustrate the number of railway commuters, and the actual rate of punctual trains compared to the set goal, between 2000 and 2009. Overall, more people used trains over the given period. Additionally, the proportion of trains arriving on time increased, despite only fluctuating for the first six years.
Regarding passenger traffic, approximately 36 million individuals opted to use trains in 2000. After this, the figure rose moderately to over just 40 million in the following two years, before dropping back to about 36 million in 2003. Subsequently, it surged to a peak of roughly 46 million by 2005, followed by a significant decrease to less than 40 million in 2008. A minimal recovery in the end saw the number of commuters reach around 41 million.
Concerning the punctuality rate, 92% of trains were on time in 2000 and this figure rose considerably to 95% by 2002, which was the target for the whole period. After ascending continuously to 96% by 2004, it plunged back to 92% in 2006. Finally, the proportion of trains arriving on schedule rocketed to 97% in 2008 and remained stable for the last year of the period.
Sample 3:
The first line graph illustrates the figures for rail users between 2000 and 2009. The second graph shows the percentage of trains being punctual in comparison with the target over the same period.
It is clear that the figures in both graphs fluctuated over the nine-year period. Ridership peaked at the mid-period (2004 2005), while the percentage of punctual trains reached its peak towards the end of the period measured.
The number of people riding the train started at 36 million in 2000. Over the next five-year period, there was an overall increase in the figures for train passengers, despite a dip between 2002 and 2003. The ridership peaked at around 47 million in 2005, then declined gradually until 2008. From 2008 to the end of the period shown, the figure rose by roughly 1 million.
The target for the percentage of train punctuality was a constant 95% throughout the period. In the year 2000, the actual figure was 3% short. It picked up to meet the target in 2002, before taking a steady and gradual rise to 96% in the next 2 years. However, the figure took a sharp dive of 4% from 2004 to 2006 to be the same as the original 2000 figure. From 2006 to 2008, there was a surge in the proportion of punctual trains to reach its peak of 97%, before levelling off in the last year of the period.
Sample 4:
The given graphs provide data for train passengers between 2000 and 2009 as well as comparing the actual percentage of punctual trains with an established target.
Overall, the number of passengers travelling by train fluctuated during this period. Also, although there were variations in the percentage of on-time trains, figures largely stood below the expected level.
Starting at 35 million in 2000, the number of rail passengers witnessed a small rise to 40 million in 2002, followed by a slide back to the starting point a year later. Another increase took place until 2005, peaking at 45 million, then a continuous decline until 2008, before a minimal rise to 40 million terminated the period.
The standardised proportion of punctual trains was 95%, which was met for the first time in 2002. Good performance extended for a few more years before the figure plunged to as low as 92.2% in 2006. However, immediately in the next year, performance started to recover, exceeding the target by 5 percentage points in 2008 and remaining there until 2009.
Sample 5:
The charts show how many passengers traveled by train between 2000 and 2009, along with the punctuality rate of trains.
Overall, there was an upward fluctuation in the number of rail passengers during the given period. Additionally, except for the period between 2004 and 2006, more trains ran punctually. Although the punctuality target remained unchanged, it was either achieved or exceeded only from 2002 to 2005 and again during the last two years of the period in question.
At the beginning of the period, 40 billion people traveled by train, after which it had risen steadily, reaching a peak of roughly 49 billion by 2005, despite a slight drop in 2003. Between 2005 and 2008, a gradual decline of about 9 billion passengers was witnessed, with a subsequent recovery to approximately 45 billion in the final year.
During the whole period, the punctuality goal was consistently set at 95%. The percentage of trains being punctual, meanwhile, increased considerably from 92% initially to 96% 4 years later, followed by a substantial fall to the former level in 2005. Thereafter, the figure soared to a high of 97% in 2008 before leveling off toward the end of the time frame.
Sample 6:
The given image presents two-line graphs related to train transportation over a decade, from 2000 to 2009. The first graph depicts the number of train passengers per year, measured in billions, while the second graph illustrates the percentage of trains that operated on schedule, alongside a target performance line for comparison.
Overall, while the number of passengers using trains did not change dramatically from 2000 to 2009, the on-time performance of trains exhibited significant fluctuations, with periods of both underperformance and overachievement in relation to the set target.
From the first graph, it is evident that the number of train passengers fluctuated throughout the period but did not exhibit a clear trend of increase or decrease over the years. Passenger numbers started at around 40 billion in 2000, experienced minor fluctuations, reaching a peak slightly above 40 billion around 2004, and ended the period with a similar value to when it started.
The second graph, which measures punctuality, shows more variability. In 2000, about 93% of trains ran on time. This figure dropped to approximately 91% in the following year and then followed a downward trend, reaching the lowest point at just above 90% in 2002. A significant recovery occurred in 2003, with on-time performance soaring to around 96%, well above the standard target line set at 95%. After 2003, there was a marked decrease, hitting the lowest punctuality rate of the decade in 2007, with less than 92% of trains on time. However, there was a remarkable improvement in the following two years, with the percentage of trains running on time surpassing the target in 2009.
Sample 7:
The initial line graph provides an overview of the changes in the number of train commuters, with the second graph showing the punctuality of this means of transportation compared to a fixed target from 2000 to 2009.
Overall, there were upward fluctuations in the volume of passengers, but this was predominantly due to inconsistencies in train punctuality.
It was expected that a target of 95% punctuality was set for all trains. However, in the first year, only 92% of trains were on time, which later steadily increased to a satisfactory 95.5% in 2003. Over the specified time period, there was a gradual rise in the figure for travelers to approximately 5 million in 2002, before dropping slightly below the initial data in 2003.
During the subsequent two years, there was a remarkable surge in the quantity of passengers, reaching a peak of around 47 million in 2005, followed by a significant decline of about four million. In terms of punctuality, the rate was 96% in 2004 but experienced a minor decrease in 2006. In the last three years, the passenger number stabilized at around 43 million, with a progressive improvement in the proportion of on-time trains, ultimately reaching an impressive 97%.
Sample 8:
The upper graph illustrates the changes in the number of passengers travelling by train in an unspecified geographical location, and the lower graph shows the proportion of trains running on time in a 10-year period from 2000 to 2009 compared to the fixed target of 95%.
Overall, the number of travellers using trains showed an unsteady upward trend. The rate of trains running on time was also erratic, meeting or exceeding the target from 2002 to 2005, and again from 2008 to 2009.
In the first four years, the number of train travellers rose from around 37 million to its first peak of about 37 million in 2002, before dropping to just below its starting number in 2003. Also in that period, the rate of on-time trains went from an inadequate 92% to a sufficient 95.5%. During the next three years, train passengers rose sharply and hit the most significant peak of around 47 million in 2005; thereafter the figure started declining by approximately four million. In terms of running time efficiency, the rate was 96% in 2004, but later fell drastically to 92% in 2006.
In the last three years, the number of passengers stabilized at around 43 million while the proportion of on-time trains improved gradually and eventually plateaued at 97%.
Sample 9:
The line charts illustrate train passenger numbers and the figure for train punctuality between 2000 and 2009.
Overall, the number of passengers opting for trains fluctuated mildly over time. It can also be seen that the proportion of trains adhering to the schedule oscillated considerably, with half of the time punctuality goal not being met.
The number of train commuters fluctuated around 40 million people over the period. In 2000, 38
million travelers chose this vehicle as their means of transportation. This figure rose slightly, but
fell back again to 38 million in 2003. An increasing use of railways was reported in the following 2 years with trains attracting the highest number of customers in 2005, at 46 million. After a period of 3-year decline and 1-year growth in its users, trains received 41 million people in 2009.
Looking at the second paragraph, the punctuality target of trains was invariably 95%. In 2000, only 92% of total trains ran on time. Over the next 4 years, the proportion of punctual trains rose substantially, meeting the goal of 95% in 2002 before exceeding the target by 1% in 2004. The percentage then declined considerably to 92% in 2006, and train punctuality didn't meet the target again until late 2007. By 2009, the punctuality figure had increased to 97%, 2% higher than the goal.
Sample 10:
The provided graphs depict the trends in the number of train passengers and the percentage of trains running on time compared to the target from 2000 to 2009.
Overall, the number of travellers using trains showed an unsteady upward trend, with minor fluctuations throughout the period. Similarly, the rate of trains running on time exhibited erratic behavior, meeting or surpassing the target intermittently.
In 2000, approximately 38 million people travelled by rail. This number fluctuated until it peaked at nearly 50 million passengers in 2005. Subsequently, there was a decrease to 40 million passengers in 2008, followed by a slight rise to around 42 million in 2009.
Regarding the punctuality of trains, in 2000, the rate of trains running on time stood at 92%, slightly below the target of 95%. This rate gradually increased to 96% in 2004 before dropping to 92% in 2006. However, there was a significant rise to 97% by 2008, maintaining this level until 2009.
Sample 11:
The provided charts offer insights into the passenger volumes on trains from 2000 to 2009 and their punctuality compared to the set targets.
Overall, it is evident that there were fluctuations in passenger numbers and punctuality rates over the specified period.
In 2000, approximately 38 million passengers opted for rail travel. This figure experienced an upward trend, reaching its zenith at nearly 50 million in 2005, before a subsequent decline to 40 million in 2008. The year 2009 saw a moderate resurgence, with approximately 42 million passengers.
In terms of punctuality, trains achieved a 92% on-time rate in 2000, falling short of the 95% target. The subsequent years witnessed a progressive increase, peaking at 96% in 2004. However, there was a dip in punctuality to 92% in 2006, lower than the standard target of 95%. The subsequent years saw a commendable recovery to surpass the 95% target, with rates reaching 97% in 2008 and maintaining this level thereafter.
Sample 12:
The line graphs illustrate how many people traveled by train between 2000 and 2009 and how punctual trains were during this period.
Overall, it can be seen that both the number of passengers and the punctuality of the railway system fluctuated over the period shown.
Regarding train usage, the number of travelers varied in the first half of the period, after which it grew noticeably and reached its peak of over 47 million in 2005. However, the following three consecutive years witnessed a slow decline of about 7 million in the number of train commuters before the figure rose to roughly 42 million in 2009.
In terms of punctuality, despite the expectation that 95% of trains would run on time, the rate was 92% at the beginning of the period. The figure then increased, met its objective in 2002, and continued to rise to 96% in 2004. However, the railway system failed short of its target again between 2005 and 2007. Afterward, punctuality significantly improved and exceeded the aim in the last two years of the period (at 97%).
Hot: 1000+ Đề thi cuối kì 2 file word cấu trúc mới 2026 Toán, Văn, Anh... lớp 1-12 (chỉ từ 60k). Tải ngay
CÂU HỎI HOT CÙNG CHỦ ĐỀ
Lời giải
Sample 1:
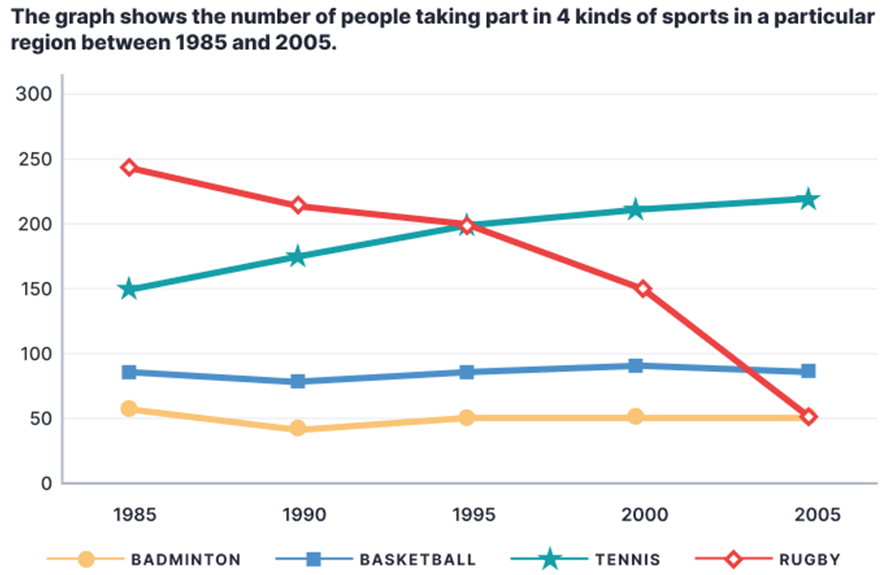
The line chart illustrates how many people participated in 4 distinct types of sports in a particular area from 1985 to 2005.
Overall, rugby was the most popular sport in the first half of the period while tennis took the lead in the second half. In addition, rugby saw a downward trend while tennis took the opposite direction; moreover, the trends for basketball and badminton were relatively stable.
In 1995, the number of people playing rugby stood at just under 250, surpassing the figure for tennis players by around 100. Basketball and badminton had comparatively lower participation rates, with around 80 and 50 participants in turn.
Afterwards, the number of people participating in rugby plunged, hitting a low of 50 in 2005, equal to the figure for badminton in the same year. In contrast, the trend for tennis was upward, with its participation rate increasing to roughly 220 people at the end of the period, establishing it as the leading sport. Finally, the figures for basketball and badminton underwent negligible changes, hovering around 80 and 50 participants respectively.
Sample 2:
The line graph illustrates how many people participated in four types of sports in a specific area from 1985 to 2005. Overall, there was a significant decrease in the number of people playing rugby in this region, whereas tennis showed a gradual upward trend to become the most popular sport in the second half of the period. Additionally, throughout the period, the trends for basketball and badminton were relatively stable and comparable, with the latter sport remaining the least common.
In the first decade, rugby had the highest number of players, despite witnessing a steady fall from nearly 250 to exactly 200 participants. From 1995 onwards, this sport kept losing popularity as its figure plummeted, reaching parity with badminton (at 50 people) in the final year.
In contrast, tennis was gaining popularity and had become the dominant category by the end of the timeframe. Specifically, starting at the second highest (at 150), the number of people engaging in tennis rose continually, overtaking that of rugby in 1995 before ending at approximately 250 players.
Meanwhile, roughly 80 people played basketball initially, after which it stayed virtually unchanged until the end of the period. Badminton almost exactly mirrored this trend, albeit at a lower rate, consistently hovering around the 50 mark.
Sample 3:
The line chart compares the number of participants in basketball, tennis, badminton and rugby over a 20-year period from 1985 in a specific area.
Overall, more people played tennis throughout the period, and it was the most common sport since 1995, while rugby's popularity declined. Notably, basketball and badminton mostly had stable numbers of players.
In terms of tennis and rugby, both sports indicated inverted trends. Although rugby started at the highest point with nearly 250 players, the figure declined continually to about 200 players in 1995, when this sport was no longer the most popular. Since then, the number of people playing rugby dropped more steeply, reaching 50 in 2005. In contrast, from 1985 onwards, the figure for tennis increased steadily from second place with 150 participants. By 2005, it had reached its highest point of roughly 220 players.
In comparison, there were far fewer people who took up basketball and badminton. However, these sports remained relatively stable, with basketball having about 70 participants every year, while badminton was always the least popular with approximately 50 players each year.
Sample 4:
The line graph provides information about the number of individuals engaging in four types of sports in a specific area from 1985 to 2005.
Overall, while tennis underwent a surge in popularity, rugby experienced a decrease in participation within this region over time, with basketball and badminton remaining relatively stable. Moreover, the most drastic shift in popularity was witnessed in rugby.
At the start of the period, in 1985, rugby was the most played sport, with 240 individuals participating, and it significantly outnumbered the next sport, tennis, which had only 150 participants. Thereafter, the number of people playing rugby dropped to 200 in 1995, before plummeting to a 20-year low of 50 in the final year. This stood in stark contrast to the rise in the popularity of tennis, which saw a steady increase in participants to a peak of about 220 in 2005, making it by far the most played sport at the end of the period.
Turning to the remaining sports, in the first year, 80 individuals played basketball, almost 25 more than badminton. Over the following decade, the participant numbers for basketball rose to about 90, while those for badminton dropped to a low of 45 in 1995. In the remaining period, these two sports maintained their popularity, as the numbers participating stayed at roughly the same level until 2005.
Sample 5:
The line chart delineates the participation levels in four distinct sports in a specific area from 1985 to 2005.
Primarily, rugby emerged as the most favored sport in the initial half of the period, while tennis took precedence in the latter half. Moreover, rugby exhibited a declining trend, whereas tennis experienced a converse trajectory. Meanwhile, the engagement rates for basketball and badminton remained relatively consistent.
In 1985, the number of rugby participants stood at just below 250, exceeding the tennis players by approximately 150 individuals. Simultaneously, basketball and badminton showcased lower participation rates, with around 80 and 50 individuals involved in each sport, respectively.
Subsequently, rugby participation plummeted significantly, reaching a nadir of 50 participants in 2005, akin to the number engaged in badminton during the same year. Conversely, tennis experienced an upward trend, escalating to nearly 220 individuals by the conclusion of the period, solidifying its status as the predominant sport. In contrast, the figures for basketball and badminton remained relatively stable, with approximately 80 and 50 participants, respectively, throughout the entire duration.
Sample 6:
The given line graph delineates the participation levels in 4 different sports, namely basketball, tennis, badminton, and rugby within a specific region over a span of 20 years.
Overall, it is evident that the number of individuals participating in tennis witnessed a consistent and notable increase, contrasting sharply with the downward trend observed in rugby participation. Meanwhile, while basketball and badminton recorded lower participation rates compared to other sports, they remained relatively stable throughout the entire period.
Turning to the number of tennis players, the figures began at a relatively moderate level of 150 individuals in 1985. Subsequently, it experienced a gradual and consistent increase in participation, reaching a pinnacle of nearly 230 participants by 2005. In stark contrast, the trend of rugby involvement presented a distinctive pattern. Commencing at a relatively high level of almost 240 people, the numbers steadily declined over time and by the end of the 20-year period, rugby participants had dwindled to 50, matching the level of engagement observed in badminton. Interestingly, a point of convergence occurred in 1995, where both tennis and rugby shared a similar number of participants, with approximately 200 individuals engaging in each sport.
In regard to the remaining sports participants, the numbers for both badminton and basketball remained relatively stable over the given time frame. Beginning with approximately 50 individuals engaging in badminton and around 80 individuals involved in basketball in 1985, these figures persisted with little variation until 2005. Consequently, by the end of the period, both sports witnessed a culmination with nearly the same number of participants as they had at the beginning.
Lời giải
Sample 1:
Many young people work on a voluntary basis, and this can only be beneficial for both the individual and society as a whole. However, I do not agree that we should therefore force all teenagers to do unpaid work.
Most young people are already under enough pressure with their studies, without being given the added responsibility of working in their spare time. School is just as demanding as a full-time job, and teachers expect their students to do homework and exam revision on top of attending lessons every day. When young people do have some free time, we should encourage them to enjoy it with their friends or to spend it doing sports and other leisure activities. They have many years of work ahead of them when they finish their studies.
At the same time, I do not believe that society has anything to gain from obliging young people to do unpaid work. In fact, I would argue that it goes against the values of a free and fair society to force a group of people to do something against their will. Doing this can only lead to resentment amongst young people, who would feel that they were being used, and parents, who would not want to be told how to raise their children. Currently, nobody is forced to volunteer, and this is surely the best system.
In conclusion, teenagers may choose to work for free and help others, but in my opinion, we should not make this compulsory.
Sample 2:
Some individuals nowadays feel that youngsters should accomplish unpaid volunteer work in their leisure time for the benefit of society. I completely believe that it is critical to involve children in volunteer activity. The primary issues will be discussed with examples in this essay.
To begin with, teenagers who participate in unpaid employment are more responsible for local society. When adolescents interact with other individuals, they become aware of the issues that people face daily, such as poverty, pollution, and others. Furthermore, we have all been affected by the present COVID-19 outbreak, and many people have suffered a loss. According to "The Voice of Vietnam - VOV” a volunteer who is anti-virus and empathizes with the mental pain that the patients are experiencing, he always gives oxygen and food to those who need it the most. As a result, volunteering helps students become the most responsible citizens in the country.
Furthermore, unpaid employment can assist youngsters in broadening their social contacts and developing soft skills. Because when they work in an unpaid job, they will meet a variety of individuals and acquire a range of skills and abilities from others, such as leadership, teamwork, communication, and dealing with challenging situations. For example, a recent study in Japan discovered that students who participate in volunteer work are more sociable, enthusiastic, and tolerant of others. They will grow more extroverted, energetic, and hard-working as compared to youngsters who do not perform unpaid employment.
To conclude, I feel that rather than paying, young people should perform unpaid social work because they can acquire many important skills and are more responsible to society.
Sample 3:
There is a growing debate about whether all adolescents should be asked to perform mandatory volunteer work in their leisure time to help assist the surrounding area. Although there are a variety of benefits associated with this topic, there are also some notable drawbacks, as will now be discussed.
The advantages of teenagers doing voluntary work are self-evident. The first relevant idea is work experience. A valid illustration of this would be to increase their tangible skills. For example, an adolescent who volunteers to help in a customer service department will learn how to communicate effectively with people in different age groups. On a psychological level, the youth’s life skills will also be enhanced by having empathy towards others. This can be demonstrated by volunteering and assisting families living in low socio-economic backgrounds with their day-to-day tasks.
There are, however, also drawbacks that need to be considered. On an intellectual level, the teenager may get distracted from their study. This situation, for instance, can be seen when voluntary work is also being undertaken during school terms. There would be time constraints for both areas. On a physiological level, youth might experience fatigue as they are unaware of the acceptable working or volunteering hours and, as a result, sometimes they can be overworked.
In summary, we can see that this is clearly a complex issue as there are significant advantages and disadvantages. I personally believe that it would be better not to encourage the youths to do compulsory work because their studies might take them to a higher level in society, whereas volunteering could restrict this progress.
Sample 4:
Children are the backbone of every country. So, there are people who tend to believe that youngsters should be encouraged to initiate social work as it will result in flourished society and individualistic growth of youngsters themselves. I, too, believe that this motivation has more benefits than its drawbacks.
To begin with, social work by children can be easily associated with personality development because, during this drive, they tend to communicate with the variety of people, which leads to polished verbal skills. For example, if they start convincing rural people to send their children to school, they have to adopt a convincing attitude along with developed verbal skills to deal with the diverse kinds of people they encounter. This improved skill will help them lifelong in every arena. Apart from this, the true values of life like tolerance, patience, team spirit, and cooperation can be learned. Besides that, young minds serve the country with full enthusiasm that gives the feeling of fulfillment and self-satisfaction. This sense of worthiness boosts their self-confidence and patriotic feelings. Moreover, experiencing multiple cultures and traditions broadens their horizons and adds another feather to their cap.
However, it is truly said, no rose without thrones. Can the drawbacks of this initiation be ignored? Children go to school, participate in different curriculum activities, endure the pressure of peers, parents, and teachers and in the competitive world, they should not be expected to serve society without their self-benefits. This kind of pressure might bring resentment in their mind.
In conclusion, I believe, the notion of a teenager doing unpaid work is indeed good but proper monitoring and care should be given to avoid untoward consequences.
Sample 5:
Youngsters are the building blocks of the nation and they play an important role in serving society because at this age they are full of energy not only mentally but physically also. Some people think that the youth should do some voluntary work for society in their free time, and it would be beneficial for both of them. I agree with the statement. It has numerous benefits which will be discussed in the upcoming paragraphs.
To begin with, they could do a lot of activities and make their spare time fruitful. First of all, they can teach children to live in slum areas because they are unable to afford education in schools or colleges. As a result, they will become civilized individuals and do not indulge in antisocial activities. By doing this they could gain a lot of experience and become responsible towards society. It would be beneficial in their future perspective.
In addition to this, they learn a sense of cooperation and sharing with other people of the society. for instance, they could grow plants and trees at public places, and this would be helpful not only to make the surrounding clean and green but reduce the pollution also to great extent. Moreover, they could arrange awareness programmes in society and set an example among the natives of the state. This will make the social bonding strong between the individuals and this will also enhance their social skills.
In conclusion, they can “kill two birds with one stone” because it has a great advantage both for the society and for the adolescents. Both the parents, as well as teachers, should encourage the teens to take part in the activities of serving the community in their free time.
Lời giải
Bạn cần đăng ký gói VIP ( giá chỉ từ 250K ) để làm bài, xem đáp án và lời giải chi tiết không giới hạn.
Lời giải
Bạn cần đăng ký gói VIP ( giá chỉ từ 250K ) để làm bài, xem đáp án và lời giải chi tiết không giới hạn.
Lời giải
Bạn cần đăng ký gói VIP ( giá chỉ từ 250K ) để làm bài, xem đáp án và lời giải chi tiết không giới hạn.
Lời giải
Bạn cần đăng ký gói VIP ( giá chỉ từ 250K ) để làm bài, xem đáp án và lời giải chi tiết không giới hạn.
Lời giải
Bạn cần đăng ký gói VIP ( giá chỉ từ 250K ) để làm bài, xem đáp án và lời giải chi tiết không giới hạn.