


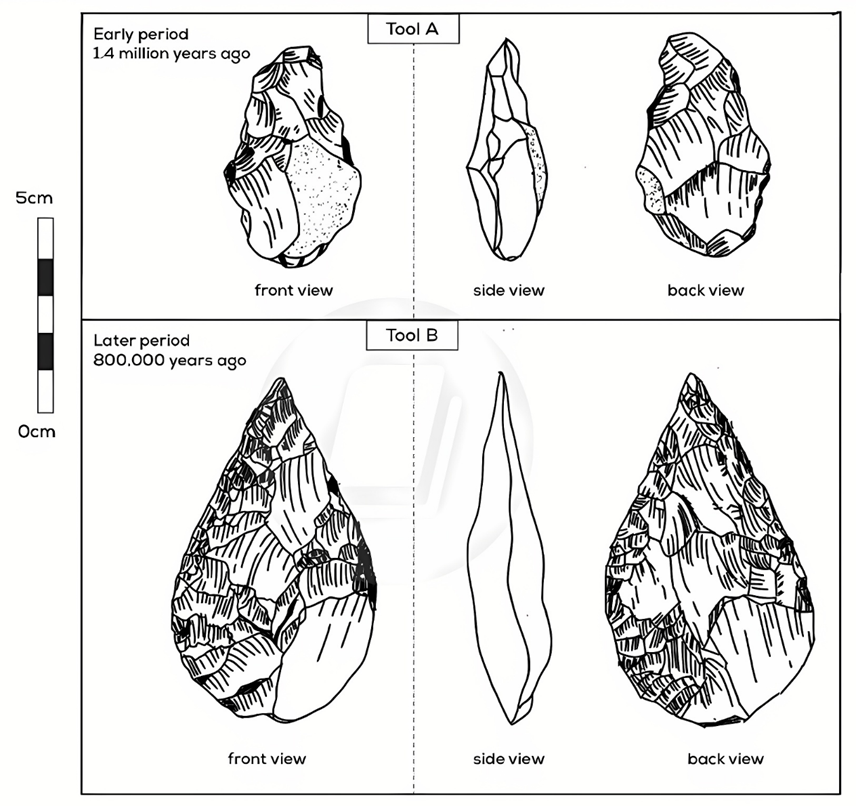
The diagrams below show two cutting tools made from stone. They are from an early period and a later period of human history. The tools were made by breaking off small pieces of stone.
Summarise the information by selecting and reporting the main features, and make comparisons where relevant. Write at least 150 words.
Summarise the information by selecting and reporting the main features, and make comparisons where relevant. Write at least 150 words.
Câu hỏi trong đề: 2000 câu trắc nghiệm tổng hợp Tiếng Anh 2025 có đáp án !!
Quảng cáo
Trả lời:
Sample 1:
The diagrams illustrate a pair of stone cutting implements, namely tool A and tool B, which find their origins in two differing periods of human history. They were crafted through the technique of chipping away small fragments of stone.
Overall, there were noticeable differences between the two tools, with the one from 0.8 million years ago having greater dimensions, less rugged surfaces, and more uniform edges in comparison with its earlier counterpart.
Looking first at tool A, which dates back to 1.4 million years ago, it appears to be highly primitive. This artifact measures approximately 7 centimeters in height and 3 centimeters in width, and its thickness falls within the range of 2 to 3 centimeters. Similar to the later version, tool A features a rounded base, tapering toward the top. The latter, however, has much rougher surfaces when viewed from the front and the back, thus contributing to its more jagged edges and a less defined pointed end.
Tool B, on the other hand, shows a more refined appearance, resembling a teardrop, as its tip is notably sharper while the sides are also smoother. In contrast to tool A, the front and back of tool B look somewhat similar, with less surface roughness. Furthermore, Tool B is about 5 centimeters longer and 2 centimeters wider than its predecessor, although the thickness is almost exactly the same.
Sample 2:
The diagrams chart the evolution of a cutting tool from its rudimentary form 1.4 million years ago to a more refined version 0.8 million years ago during the Stone Age.
Initially resembling a natural stone, the tool underwent significant enhancements, culminating in a more efficient and effective cutting instrument.
Approximately 1.4 million years ago, the tool took on a basic form, closely looking like a natural stone, indicating minimal crafting. Tool A displayed an oval shape from both the front and side views, with a coarse texture and blunt edges, suggesting it was not refined.
Over the subsequent 0.8 million years, significant improvements were made. The tool evolved into a spear-shaped implement with a much sharper tip and edges. Although Tool A maintained the same length at 10 centimeters, it featured a smoother surface and increased overall width. These enhancements markedly increased its cutting efficiency, making this version far superior.
Sample 3:
The diagram presents a comparison of prehistoric tools dating back 1.4 and 0.8 million years ago. Overall, the older tool is less refined with rougher edges, while the newer one appears smoother and better preserved.
Comparing the two tools from the frontal view, the one from 1.4 million years ago is slightly narrower, displaying a less defined shape. The more recent one comes to a sharper point with clearly rounded sides.
The side view reveals that the older tool is also bulkier with more jagged indents than the much smoother one from 800,000 years ago. Finally, in terms of the back view there is a distinctive contrast as the newer has fewer major cracks and closely mirrors its front side. The older tool, on the other hand, is approximately half the size overall and is chipped down greatly in the back.
Sample 4:
The presented illustration demonstrates some of the first cutting stone tools ever invented and how they transformed and improved over the course of human civilization – from 1.4 million years ago to 800 thousand years ago. It is clear that the same tool underwent radical changes and became sharper, better and more effective through the ages.
The stone tool made 1.4 million years ago was more rounded at the top and bottom edges. From the front and back view of the tool, it is clear that the diameter in the middle was almost 5 cm, and towards the top and bottom, it was around 3 cm wide. The side view shows that the tool was wider in the middle, with a diameter of approximately 3 cm, and it tapered towards the top, and the bottom ends. The back of the stone had fewer cuts than the front, and they were also particularly sharp or fine, decreasing their overall capabilities.
800 thousand years ago, this tool developed into a sharper, more refined one. The front and the back view show that the maximum diameter of the tool was the same as in the older tool, but it was more towards the lower side. The bottom tapered into a 1 cm point, but the top tapered more sharply into a 1 cm point. The side view clarifies that it was much less in width (1.5 cm) than the older tool. The stone was more chiseled than the previous one.
Sample 5:
The illustration details the evolution of stone cutting tools used by prehistoric men in the Stone Age.
As is evident from the diagram, the key difference between the cutting tools in the two periods is the size, with the latter version becoming noticeably larger. Tool B also appears more refined than tool A in terms of shape and sharpness.
1.4 million years ago, the cutting tool was thin, measured 7-8 centimeters in length, and did not display much craftsmanship. They were also rather uneven in appearance: the front and the back were shaped differently, and the surface appears to have been quite rough.
600,000 years later, it is obvious that the cutting tools used by man in the Stone Age had become significantly more advanced. First of all, they were larger, measuring 10-11 centimeters in length, and had a more definite tear-drop shape: fat at the base and tapering aggressively toward a sharp tip whereas the prior versions tended to be obtuse. Second, both front and back sides were ground more evenly and smoothly. It would also seem that man had learnt to sharpen the sides of their cutting tools as well.
Sample 6:
The provided illustrations delineate a comparative analysis of two distinct Stone Age cutting implements, denoted as Tool A and Tool B, with origins dating back to disparate epochs in human evolution, specifically 1.4 million and 0.8 million years ago, respectively. It is imperative to underscore that this temporal span of 0.6 million years had witnessed a discernible evolution in the characteristics of these implements, most notably manifesting in alterations pertaining to their dimensions, forms, and surface attributes.
The initial impression from the first figure is that Tool A appears to exhibit a rudimentary and austere design, reflective of limited craftsmanship. This artifact assumed an undefined shape, possessing a circular base that gradually tapers towards its apex, with the widest section positioned at its center, presumably to facilitate grip and manipulation. Tool A is recorded to possess dimensions, with a height and width encompassing approximately 7 and 3 centimeters, respectively, while its thickness falls within the range of 2 to 3 centimeters. A comprehensive examination of its anterior and posterior aspects revealed rough surfaces and jagged edges, with a rather blunt pointed end.
Subsequent to a temporal elapse of 600,000 years, it is apparent that this cutting tool has undergone a substantial transformation, attaining a refined appearance resembling a teardrop. In comparison with the previous version, Tool B exhibits an elongation of approximately 2 to 3 centimeters in both length and width whereas the thickness remained relatively unchanged. A meticulous inspection from diverse angles reveals that its surfaces have transcended their primitive ruggedness, now presenting smoother and more finely contoured edges, along with a notably pointed tip. This transformation implies an advanced utility in comparison to the antecedent.
It is intriguing to note that Tool A had experienced a remarkable transformation from a rudimentary object into an enhanced knife-like cutting implement over the course of 0.6 million years. This transformation underscores the adaptive capacities of early humans, delineating the trajectory of technological progress in the field of tool manufacture and utilization.
Sample 7:
The diagram depicts ancient cutting tools made from stone by early humans from 1.4 million and 0.8 million years ago, which were viewed from the front, side and back with length measurement in centimeters.
Generally, it can be seen that the tool from 800 thousand years ago was larger, longer and more well made than its earlier counterpart.
Approximately 1.4 million years ago, the cutting tool was relatively small with 7cm in length. From the front and back view, the overall shape was irregular, the stone surface was rugged while the side view showed an uneven edge.
The tool saw notable improvements 600 thousand years later. The stone blade was 1.5 times longer at nearly 10cm in length. The shape was more defined, which closely resembled a water droplet, and the surface was noticeably smoother viewing from the front and back. The side view also showed a sharpened edge for better cutting.
Sample 8:
The given diagram compares stone age cutting tools at 1.4 million and 0.8 million years ago. Overall, the latter one appears to be bigger in size and its shape was also better refined with sharper, more uniform edges and a pointed end.
To begin with, tool A, dated 1.4 million years ago, has a height and width of about 7.5 and 3 centimeters respectively, and is around 1-2cm thick. From the front view, there were large random cuts which created rough edges and a tapered end. From the other sides, similar cuts can be seen, and a sharp end was formed at the top of the tool.
Turning to Tool B, we can see that after 0.6 million years, the cutting tool had doubled in size, with a height of about 10 centimeters and a width of slightly over 6 centimeters, whereas it retained a similar thickness. A look from the front and the back of tool B reveals that its outer shape became significantly finer with a sharp pointy top and a smooth curved bottom. Its side view also witnessed a remarkable transformation which made the tool take the shape of a leaf with a sharp edge running across the tool.
Sample 9:
The presented pictures illustrate how cutting tools in the Stone Age evolved from 1.4 million years ago to 0.8 million years ago.
Overall, it can be concluded that in over 0.6 million years, the tools witnessed a dramatic change both in size and shape. In addition, these developments increased the effectiveness of the cutting instruments.
Regarding the front view, tool A had rough edges and no clear shape, whereas tool B had a symmetrical tear-like shape along with a pointy tip. This feature would give tool B an edge over tool A when it comes to cutting food or penetrating things.
In terms of the side view and back view, tool B proved to be significantly larger as compared to tool A, which would come in handy when cutting large products. With regard to the edges, tool A and tool B showed a manifest difference. While the former’s edges were rugged and blunt, the latter’s were significantly sharper, more refined, and knife-like.
Sample 10:
The two pictures compare 2 Stone Age cutting tools which were probably made and used by ancient people.
In general, while tool A was relatively simple and rudimentary, tool B was more refined.
First, 1.4 million years ago, tool A’s measurements were approximately 9 cm in length and 5 cm in width. From the front view, it had a rough surface. With a tapering shape, its biggest part was the middle, while the two ends were much smaller. The side view shows its thickness at about 2.5 cm. In the back, the large bottom part was perhaps the handle, while the pointy tip served the cutting purpose.
Dating back to 800,000 thousand years ago, tool B was nearly 12 cm long and 8 cm wide, which was significantly larger than tool A. From the front view, tool B closely resembled a water drop with a pointy tip and a round bottom. From the side view, both the edge and the tip seem straight and sharper than tool A. The back view clearly displays the bigger size of tool B compared to tool A.
Sample 11:
The diagram illustrates the evolution of the cutting tool during the period from 1.4 million years ago to 0.8 million years ago in the Stone Age.
It can be seen that a number of upgrades were made in the shape and size of the tool so that it could become a more effective cutting instrument.
1.4 million years ago, the tool was relatively primitive and resembled a natural stone, which suggests that little crafting was done. From the front and side view, Tool A had an oval shape, rough surface and blunt edges, hence presumably the inferior version compared to Tool B.
After 0.6 million years, the tool was upgraded into a spear-shaped instrument with the tip and edges being much sharper. While Tool B was 10 centimeters long – the same length as Tool A, the surface of Tool B was crafted to be smoother and the overall width to be larger. Therefore, these features rendered this version more superior in terms of cutting efficiency.
Sample 12:
The diagram illustrates the development of the cutting tool from two different time periods within the Stone Age.
Although the overall size and shape of the two cutting tools are very similar, the cutting tool from the latter time period shows some distinct improvements.
Tool A is a depiction of a Stone Age cutting tool used approximately 1.4 million years ago, while tool B is from a later part of the Stone Age approximately 0.8 million years ago. Both cutting tools are similar in shape and size, roughly 10cm in length. However, tool A looks to be quite a crude implement, while tool B appears to have been refined into a more effective cutting device.
From the front and rear view, tool B appears to be much wider than tool A and has a rounder body shape. The cutting edges also appear to be more distinct and symmetrical. The side view shows a distinct difference in the thickness of the two tools, with tool B significantly slimmer than tool A.
Sample 13:
The pictures describe the evolution of Stone Age cutting tools between 1.4 million and 0.8 million years ago. It can be seen that the latter design had seen vast improvements in the size, shape and finishing quality.
Tool A, which dated back to 1.4 million years ago, was rather small and rudimentary. At about 7cm in length, the tool was thin and did not display much craftsmanship. The front and back view were plain with only some slight chiselling effort while the side was rough and not very indicative of a cutting utensil.
Tool B showed many updated features compared to the older version. First of all, it was larger and sturdier due to a better water drop design with a broad base and pointy top. Second, both front and back sides were grounded more evenly and smoothly. Finally, although the tool’s thickness stayed relatively the same after 0.6 million years, the side edge was undoubtedly much more finely sharpened.
Sample 14:
The pictures describe the cutting tools created by our ancestors at two different ages.
Tool A was made approximately 1.4 million years ago. It was like an animal tooth about 8 cm long with a rough surface. It may be easy to hold but it was barely sharp enough. As is shown, the front part of the cutting tool was rather broad, and its top area was a little smaller than the bottom. Seen from the side, it was just as narrow as a stick. Moreover, the back part was much flatter than the front part.
Tool B was widely used 0.8 million years ago. Both of the two tools were made of stone. However, Tool B had been better developed than the previous one. It was about 12 cm long. Its front part had been smoother with many little points, which made it similar to the surface of a diamond. Observed from the side, it had got a very acute top, which was very useful for slicing meat. In addition, the back part was even much flatter than that of the older tool.
Hot: 1000+ Đề thi cuối kì 2 file word cấu trúc mới 2026 Toán, Văn, Anh... lớp 1-12 (chỉ từ 60k). Tải ngay
CÂU HỎI HOT CÙNG CHỦ ĐỀ
Lời giải
Sample 1:
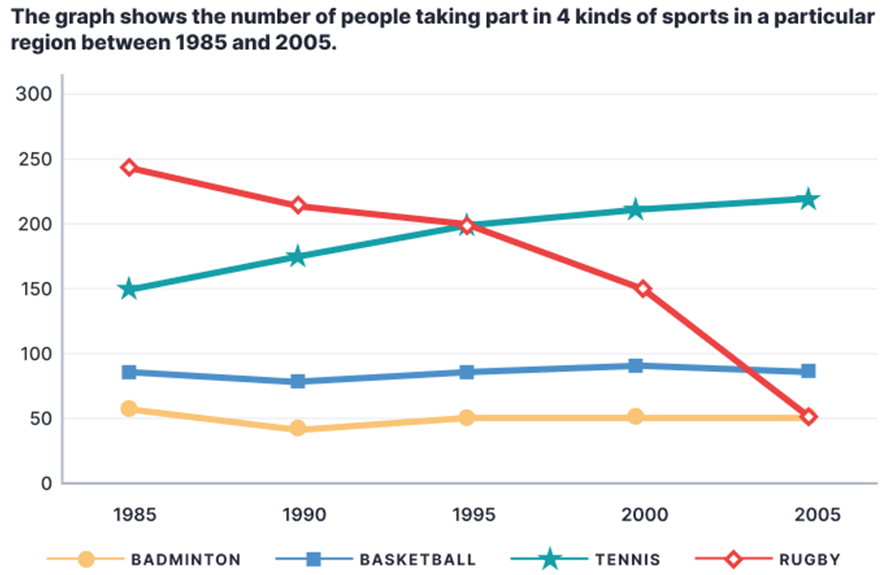
The line chart illustrates how many people participated in 4 distinct types of sports in a particular area from 1985 to 2005.
Overall, rugby was the most popular sport in the first half of the period while tennis took the lead in the second half. In addition, rugby saw a downward trend while tennis took the opposite direction; moreover, the trends for basketball and badminton were relatively stable.
In 1995, the number of people playing rugby stood at just under 250, surpassing the figure for tennis players by around 100. Basketball and badminton had comparatively lower participation rates, with around 80 and 50 participants in turn.
Afterwards, the number of people participating in rugby plunged, hitting a low of 50 in 2005, equal to the figure for badminton in the same year. In contrast, the trend for tennis was upward, with its participation rate increasing to roughly 220 people at the end of the period, establishing it as the leading sport. Finally, the figures for basketball and badminton underwent negligible changes, hovering around 80 and 50 participants respectively.
Sample 2:
The line graph illustrates how many people participated in four types of sports in a specific area from 1985 to 2005. Overall, there was a significant decrease in the number of people playing rugby in this region, whereas tennis showed a gradual upward trend to become the most popular sport in the second half of the period. Additionally, throughout the period, the trends for basketball and badminton were relatively stable and comparable, with the latter sport remaining the least common.
In the first decade, rugby had the highest number of players, despite witnessing a steady fall from nearly 250 to exactly 200 participants. From 1995 onwards, this sport kept losing popularity as its figure plummeted, reaching parity with badminton (at 50 people) in the final year.
In contrast, tennis was gaining popularity and had become the dominant category by the end of the timeframe. Specifically, starting at the second highest (at 150), the number of people engaging in tennis rose continually, overtaking that of rugby in 1995 before ending at approximately 250 players.
Meanwhile, roughly 80 people played basketball initially, after which it stayed virtually unchanged until the end of the period. Badminton almost exactly mirrored this trend, albeit at a lower rate, consistently hovering around the 50 mark.
Sample 3:
The line chart compares the number of participants in basketball, tennis, badminton and rugby over a 20-year period from 1985 in a specific area.
Overall, more people played tennis throughout the period, and it was the most common sport since 1995, while rugby's popularity declined. Notably, basketball and badminton mostly had stable numbers of players.
In terms of tennis and rugby, both sports indicated inverted trends. Although rugby started at the highest point with nearly 250 players, the figure declined continually to about 200 players in 1995, when this sport was no longer the most popular. Since then, the number of people playing rugby dropped more steeply, reaching 50 in 2005. In contrast, from 1985 onwards, the figure for tennis increased steadily from second place with 150 participants. By 2005, it had reached its highest point of roughly 220 players.
In comparison, there were far fewer people who took up basketball and badminton. However, these sports remained relatively stable, with basketball having about 70 participants every year, while badminton was always the least popular with approximately 50 players each year.
Sample 4:
The line graph provides information about the number of individuals engaging in four types of sports in a specific area from 1985 to 2005.
Overall, while tennis underwent a surge in popularity, rugby experienced a decrease in participation within this region over time, with basketball and badminton remaining relatively stable. Moreover, the most drastic shift in popularity was witnessed in rugby.
At the start of the period, in 1985, rugby was the most played sport, with 240 individuals participating, and it significantly outnumbered the next sport, tennis, which had only 150 participants. Thereafter, the number of people playing rugby dropped to 200 in 1995, before plummeting to a 20-year low of 50 in the final year. This stood in stark contrast to the rise in the popularity of tennis, which saw a steady increase in participants to a peak of about 220 in 2005, making it by far the most played sport at the end of the period.
Turning to the remaining sports, in the first year, 80 individuals played basketball, almost 25 more than badminton. Over the following decade, the participant numbers for basketball rose to about 90, while those for badminton dropped to a low of 45 in 1995. In the remaining period, these two sports maintained their popularity, as the numbers participating stayed at roughly the same level until 2005.
Sample 5:
The line chart delineates the participation levels in four distinct sports in a specific area from 1985 to 2005.
Primarily, rugby emerged as the most favored sport in the initial half of the period, while tennis took precedence in the latter half. Moreover, rugby exhibited a declining trend, whereas tennis experienced a converse trajectory. Meanwhile, the engagement rates for basketball and badminton remained relatively consistent.
In 1985, the number of rugby participants stood at just below 250, exceeding the tennis players by approximately 150 individuals. Simultaneously, basketball and badminton showcased lower participation rates, with around 80 and 50 individuals involved in each sport, respectively.
Subsequently, rugby participation plummeted significantly, reaching a nadir of 50 participants in 2005, akin to the number engaged in badminton during the same year. Conversely, tennis experienced an upward trend, escalating to nearly 220 individuals by the conclusion of the period, solidifying its status as the predominant sport. In contrast, the figures for basketball and badminton remained relatively stable, with approximately 80 and 50 participants, respectively, throughout the entire duration.
Sample 6:
The given line graph delineates the participation levels in 4 different sports, namely basketball, tennis, badminton, and rugby within a specific region over a span of 20 years.
Overall, it is evident that the number of individuals participating in tennis witnessed a consistent and notable increase, contrasting sharply with the downward trend observed in rugby participation. Meanwhile, while basketball and badminton recorded lower participation rates compared to other sports, they remained relatively stable throughout the entire period.
Turning to the number of tennis players, the figures began at a relatively moderate level of 150 individuals in 1985. Subsequently, it experienced a gradual and consistent increase in participation, reaching a pinnacle of nearly 230 participants by 2005. In stark contrast, the trend of rugby involvement presented a distinctive pattern. Commencing at a relatively high level of almost 240 people, the numbers steadily declined over time and by the end of the 20-year period, rugby participants had dwindled to 50, matching the level of engagement observed in badminton. Interestingly, a point of convergence occurred in 1995, where both tennis and rugby shared a similar number of participants, with approximately 200 individuals engaging in each sport.
In regard to the remaining sports participants, the numbers for both badminton and basketball remained relatively stable over the given time frame. Beginning with approximately 50 individuals engaging in badminton and around 80 individuals involved in basketball in 1985, these figures persisted with little variation until 2005. Consequently, by the end of the period, both sports witnessed a culmination with nearly the same number of participants as they had at the beginning.
Lời giải
Sample 1:
Many young people work on a voluntary basis, and this can only be beneficial for both the individual and society as a whole. However, I do not agree that we should therefore force all teenagers to do unpaid work.
Most young people are already under enough pressure with their studies, without being given the added responsibility of working in their spare time. School is just as demanding as a full-time job, and teachers expect their students to do homework and exam revision on top of attending lessons every day. When young people do have some free time, we should encourage them to enjoy it with their friends or to spend it doing sports and other leisure activities. They have many years of work ahead of them when they finish their studies.
At the same time, I do not believe that society has anything to gain from obliging young people to do unpaid work. In fact, I would argue that it goes against the values of a free and fair society to force a group of people to do something against their will. Doing this can only lead to resentment amongst young people, who would feel that they were being used, and parents, who would not want to be told how to raise their children. Currently, nobody is forced to volunteer, and this is surely the best system.
In conclusion, teenagers may choose to work for free and help others, but in my opinion, we should not make this compulsory.
Sample 2:
Some individuals nowadays feel that youngsters should accomplish unpaid volunteer work in their leisure time for the benefit of society. I completely believe that it is critical to involve children in volunteer activity. The primary issues will be discussed with examples in this essay.
To begin with, teenagers who participate in unpaid employment are more responsible for local society. When adolescents interact with other individuals, they become aware of the issues that people face daily, such as poverty, pollution, and others. Furthermore, we have all been affected by the present COVID-19 outbreak, and many people have suffered a loss. According to "The Voice of Vietnam - VOV” a volunteer who is anti-virus and empathizes with the mental pain that the patients are experiencing, he always gives oxygen and food to those who need it the most. As a result, volunteering helps students become the most responsible citizens in the country.
Furthermore, unpaid employment can assist youngsters in broadening their social contacts and developing soft skills. Because when they work in an unpaid job, they will meet a variety of individuals and acquire a range of skills and abilities from others, such as leadership, teamwork, communication, and dealing with challenging situations. For example, a recent study in Japan discovered that students who participate in volunteer work are more sociable, enthusiastic, and tolerant of others. They will grow more extroverted, energetic, and hard-working as compared to youngsters who do not perform unpaid employment.
To conclude, I feel that rather than paying, young people should perform unpaid social work because they can acquire many important skills and are more responsible to society.
Sample 3:
There is a growing debate about whether all adolescents should be asked to perform mandatory volunteer work in their leisure time to help assist the surrounding area. Although there are a variety of benefits associated with this topic, there are also some notable drawbacks, as will now be discussed.
The advantages of teenagers doing voluntary work are self-evident. The first relevant idea is work experience. A valid illustration of this would be to increase their tangible skills. For example, an adolescent who volunteers to help in a customer service department will learn how to communicate effectively with people in different age groups. On a psychological level, the youth’s life skills will also be enhanced by having empathy towards others. This can be demonstrated by volunteering and assisting families living in low socio-economic backgrounds with their day-to-day tasks.
There are, however, also drawbacks that need to be considered. On an intellectual level, the teenager may get distracted from their study. This situation, for instance, can be seen when voluntary work is also being undertaken during school terms. There would be time constraints for both areas. On a physiological level, youth might experience fatigue as they are unaware of the acceptable working or volunteering hours and, as a result, sometimes they can be overworked.
In summary, we can see that this is clearly a complex issue as there are significant advantages and disadvantages. I personally believe that it would be better not to encourage the youths to do compulsory work because their studies might take them to a higher level in society, whereas volunteering could restrict this progress.
Sample 4:
Children are the backbone of every country. So, there are people who tend to believe that youngsters should be encouraged to initiate social work as it will result in flourished society and individualistic growth of youngsters themselves. I, too, believe that this motivation has more benefits than its drawbacks.
To begin with, social work by children can be easily associated with personality development because, during this drive, they tend to communicate with the variety of people, which leads to polished verbal skills. For example, if they start convincing rural people to send their children to school, they have to adopt a convincing attitude along with developed verbal skills to deal with the diverse kinds of people they encounter. This improved skill will help them lifelong in every arena. Apart from this, the true values of life like tolerance, patience, team spirit, and cooperation can be learned. Besides that, young minds serve the country with full enthusiasm that gives the feeling of fulfillment and self-satisfaction. This sense of worthiness boosts their self-confidence and patriotic feelings. Moreover, experiencing multiple cultures and traditions broadens their horizons and adds another feather to their cap.
However, it is truly said, no rose without thrones. Can the drawbacks of this initiation be ignored? Children go to school, participate in different curriculum activities, endure the pressure of peers, parents, and teachers and in the competitive world, they should not be expected to serve society without their self-benefits. This kind of pressure might bring resentment in their mind.
In conclusion, I believe, the notion of a teenager doing unpaid work is indeed good but proper monitoring and care should be given to avoid untoward consequences.
Sample 5:
Youngsters are the building blocks of the nation and they play an important role in serving society because at this age they are full of energy not only mentally but physically also. Some people think that the youth should do some voluntary work for society in their free time, and it would be beneficial for both of them. I agree with the statement. It has numerous benefits which will be discussed in the upcoming paragraphs.
To begin with, they could do a lot of activities and make their spare time fruitful. First of all, they can teach children to live in slum areas because they are unable to afford education in schools or colleges. As a result, they will become civilized individuals and do not indulge in antisocial activities. By doing this they could gain a lot of experience and become responsible towards society. It would be beneficial in their future perspective.
In addition to this, they learn a sense of cooperation and sharing with other people of the society. for instance, they could grow plants and trees at public places, and this would be helpful not only to make the surrounding clean and green but reduce the pollution also to great extent. Moreover, they could arrange awareness programmes in society and set an example among the natives of the state. This will make the social bonding strong between the individuals and this will also enhance their social skills.
In conclusion, they can “kill two birds with one stone” because it has a great advantage both for the society and for the adolescents. Both the parents, as well as teachers, should encourage the teens to take part in the activities of serving the community in their free time.
Lời giải
Bạn cần đăng ký gói VIP ( giá chỉ từ 250K ) để làm bài, xem đáp án và lời giải chi tiết không giới hạn.
Lời giải
Bạn cần đăng ký gói VIP ( giá chỉ từ 250K ) để làm bài, xem đáp án và lời giải chi tiết không giới hạn.
Lời giải
Bạn cần đăng ký gói VIP ( giá chỉ từ 250K ) để làm bài, xem đáp án và lời giải chi tiết không giới hạn.
Lời giải
Bạn cần đăng ký gói VIP ( giá chỉ từ 250K ) để làm bài, xem đáp án và lời giải chi tiết không giới hạn.
Lời giải
Bạn cần đăng ký gói VIP ( giá chỉ từ 250K ) để làm bài, xem đáp án và lời giải chi tiết không giới hạn.