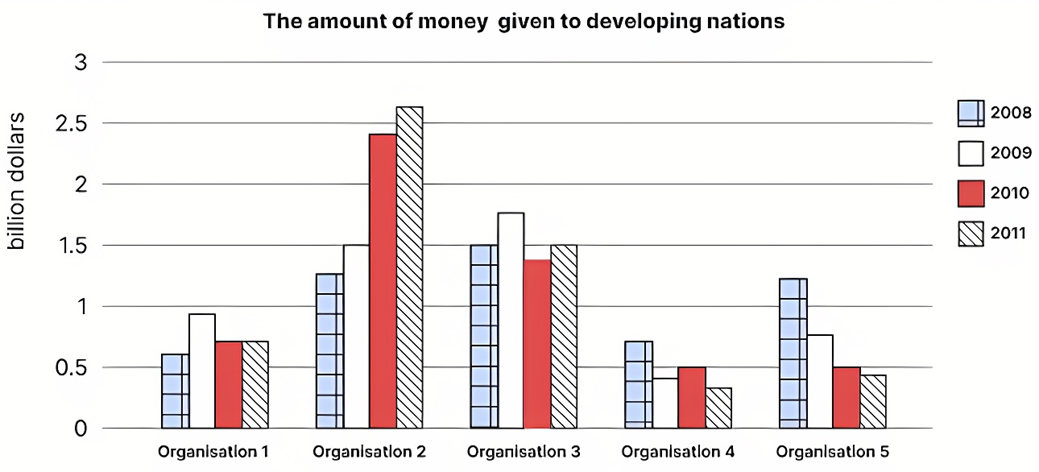
The chart below shows the amount of money given to developing countries from five organizations from 2008 to 2011.
Summarise the information by selecting and reporting the main features, and make comparisons where relevant. Write at least 150 words.
The chart below shows the amount of money given to developing countries from five organizations from 2008 to 2011.
Summarise the information by selecting and reporting the main features, and make comparisons where relevant. Write at least 150 words.
Câu hỏi trong đề: 2000 câu trắc nghiệm tổng hợp Tiếng Anh 2025 có đáp án !!
Quảng cáo
Trả lời:

Sample 1:
The bar graph compares how much money was provided by five different organisations to developing countries between 2008 and 2011. Overall, the financial allocations from organisation 2 witnessed the most significant increase while those from organisations 4 and 5 took the opposite direction. Among these, organisation 3 remained the most significant contributor during the first 2 years while this position belonged to organisation 2 in the latter half of the period.
At the start of the period, the largest funding came from organisation 3, amounting to 1.5 billion dollars. This was followed by organisation 2 and 5, with each providing an allocation of around 1.25 billion dollars. The fourth and fifth place went to organisation 4 and organisation 1, with respective figures being approximately 0.7 and 0.6 billion dollars.
Thereafter, the amount of money provided by organisation 2 registered a sharp growth to an unprecedented 2.6 billion dollars, establishing it as the organisation with the largest investment. In contrast, the trend for organisation 5 and 4 was downward, decreasing to 0.4 and 0.3 billion dollars respectively in 2011. Finally, the figure for organisation 3 and 1 witnessed fluctuations, hovering around 1.5 and 0.7 billion dollars in turn.
Sample 2:
The bar graph delineates the financial contributions made by five distinct organizations to developing nations from 2008 to 2011.
Overall, among these entities, organization 3 maintained its status as the most significant contributor during the initial two years, but organization 2 assumed this position during the latter part of the period. The funding provided by organization 2 experienced a surge, while organizations 4 and 5 witnessed a contrasting decline.
At the onset, organization 3 allocated the most substantial financial support, amounting to $1.5 billion. Following closely were organizations 2 and 5, each contributing approximately $1.25 billion. Organization 4 and organization 1 secured the fourth and fifth positions, disbursing around $0.7 and $0.6 billion, respectively.
Subsequently, Organization 2 exhibited an exponential rise in its financial provisions, skyrocketing to an unprecedented $2.6 billion, positioning it as the foremost contributor. Conversely, the financial contributions of organizations 5 and 4 followed a downward trajectory, dwindling to $0.4 and $0.3 billion, respectively, by 2011. Meanwhile, the figures for organizations 3 and 1 fluctuated, oscillating around $1.5 and $0.7 billion, respectively.
Sample 3:
The bar graph details the financial aid from five various organisations to emerging nations between 2008 and 2011. Overall, the sum of monetary resources provided by Organisations 1 and 2 increased whereas
Organisations 4 and 5 saw a downward trend and Organisation 3 remained stable despite some minor fluctuation.
Concerning the categories that rose, in 2008, the amount of funding donated by Organisation 2 was nearly double Organisation 1, at roughly $1.3 $billion, and about $0.6 billion, respectively. While Organisation 2 increased most significantly and consistently to the overall highest point of just over $2.5 billion in the end, Organisation 1 saw a slight rise to approximately $0.9 billion in 2009, followed by a drop of around $0.2 billion a year later and remained the same until the final year.
Moving to the other categories, the donations of Organisation 5 dropped constantly from roughly $1.2 billion to slightly under $0.5 billion between 2008 and 2011. Moreover, Organisation 4 contributed the least, at around $0.7 billion in 2008, dipping to about 0.3 billion in 2009 before falling further to nearly $0.2 billion in 2011. Finally, starting at the highest result of $1.5 billion at the beginning, the amount of Organisation 3 fluctuated at this level until the end, and was surpassed by Organisation 2.
Hot: 1000+ Đề thi giữa kì 2 file word cấu trúc mới 2026 Toán, Văn, Anh... lớp 1-12 (chỉ từ 60k). Tải ngay
CÂU HỎI HOT CÙNG CHỦ ĐỀ
Lời giải

Sample 1:
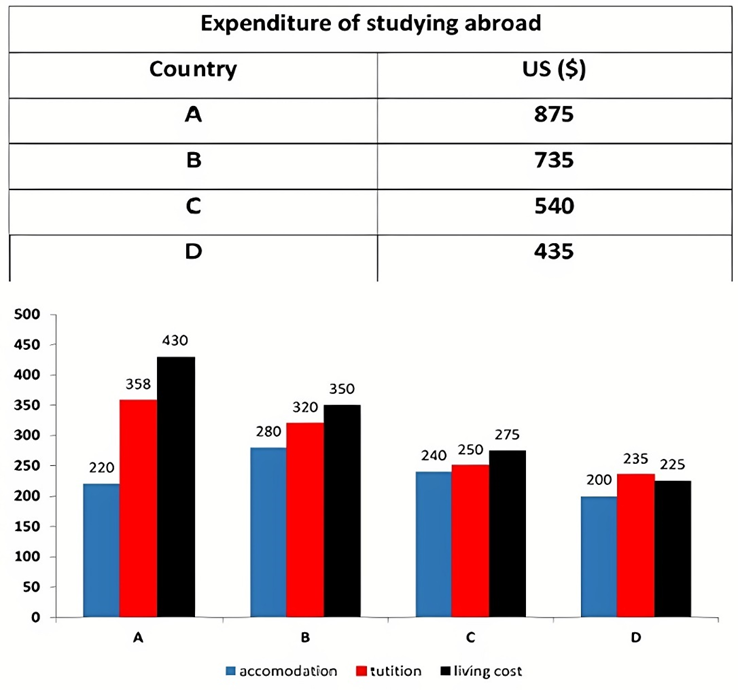
The bar graph illustrates the overseas students' spending on accommodation, tuition, and living expenses, while the table depicts information about the average weekly expenses by international students in four countries: A, B, C, and D.
Overall, foreign students need to spend the highest in country A and the lowest in D. In nearly every nation, the international students’ weekly average living expenses are the greatest, while their housing cost registers the lowest.
The costliest country for studying is A, with a weekly average expense of 875 dollars. This is followed by B, C, and D, which have weekly expenses of 735, 540, and 435 dollars, respectively. However, foreign students always pay the least for accommodation, which incurs on average weekly 220, 280, 240, and 200 dollars in the nations A, B, C, and D, respectively.
On the other hand, living expenditures account for the highest portion of average weekly costs for international students in countries A, B, and C, with 430, 350, and 275 dollars, correspondingly. Tuition fees in the same countries (A, B and C) come in second with the weekly averages of 358, 320, and 250 dollars in order. However, D is the only nation where education accounts for the highest average spending area, coming in at USD 235, followed by the cost of living (USD 225) and housing (USD 200).
Sample 2:
The table illustrates information regarding the weekly spendings by overseas students in four countries, A, B, C and D, while the bar graph depicts the students’ expenditure on the sectors, housing, education fees and living expenses.
Overall, the cost of studying abroad is the highest in country A and the lowest in D. Apart from country D, living costs account for the most part of the weekly spendings in all countries, while accommodation registers the least.
Regarding the total cost of studying, A is the most expensive country with weekly average 875 dollars, followed by B, C and D with 735, 540 and 435 dollars, respectively. On the other hand, the overseas students always spend the least on accommodation, which are on average weekly 220, 280, 240 and 200 dollars in the corresponding countries A, B, C and D.
Considering the living cost, it takes the largest share of foreign students’ average weekly expenses in countries A, B, and C with 430, 350 and 275 dollars, respectively, while tuition fees in the same countries hold the second place with weekly average 358, 320 and 250 dollars, sequentially. However, D is the only country where tuition fee occupies the highest expenditure with average weekly 235 dollars, followed by living cost (USD 225) and accommodation (USD 200.)
Sample 3:
The table and bar graph depict information regarding the weekly spendings by overseas students in countries A, B C and D.
Overall, there are three elements, housing, school fees and living costs that contribute to the total weekly spendings. The total expenditure in country A is the highest while it is the lowest in country D. Living costs account for the most part of the weekly spendings in all countries except D.
The total mean weekly cost for pupils to study in country A is US$875, next by country B at US$735, and then by country C at US$540, and finally by country D at US$435. The living costs are always the biggest component of the expenditure except for country D, with about US$10 less than the major spending which is the school fees.
Accommodation accounts for the least among all spendings in all countries. The most expensive housing is found in country B, at US$280, and the cheapest in country D at US$200. The middle range can be seen in country A at US$220 and country C at US$240, respectively. Costs of the tuition fee range between US$ 358 and US$235 in country A and D, in order.
Lời giải

Sample 1:
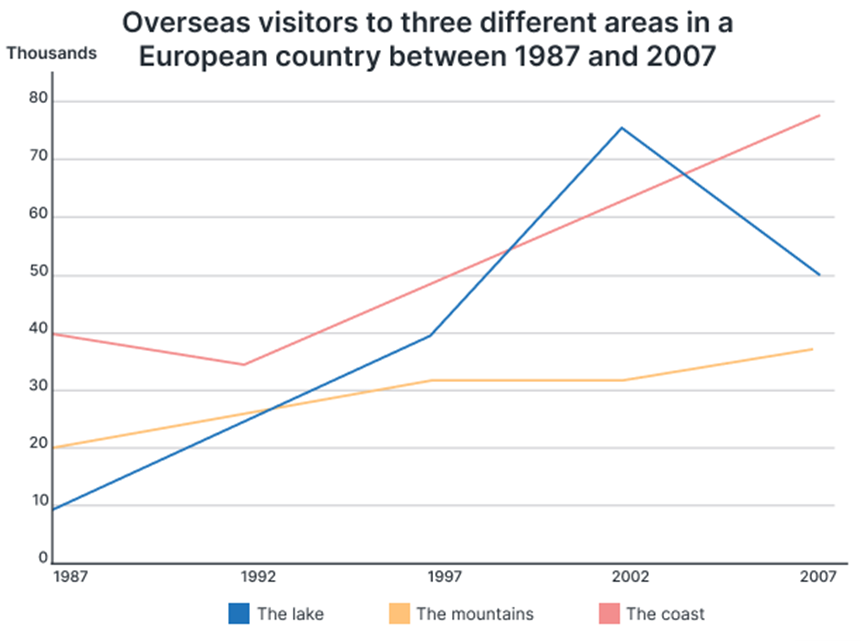
The chart illustrates a comparison of the three kinds of foreign tourist visits to a certain European nation during a twenty-year period, beginning in 1987 and ending in 2007.
Overall, the majority of survey years showed that most foreign visitors flocked to coastal locations, while mountainous places received the fewest. Furthermore, the number of visitors visiting all three locations rose throughout this time frame.
Over 40,000 tourists from outside of this European nation visited its shore in 1987. Its number plummeted to roughly 35,000 in 1992 but has steadily increased since then, peaking at over 75,000 in 2007. Meanwhile, the annual number of international visitors to the mountains ranged from 20,000 to 30,000 in the first half of the decade and then jumped to 35,000 in 2007.
For the first fifteen years, the number of international visitors to this country's lakes steadily increased, reaching a high of 75,000 in 2002. In the following years, however, this number dropped dramatically, reaching 50,000 in 2007.
Sample 2:
The chart presents a comparative analysis of three categories of foreign tourist visits to a specific European nation from 1987 to 2007.
In general, there was a consistent increase in the number of tourists across all three locations throughout the specified period. Coastal areas witnessed the highest influx of foreign tourists in almost all the periods.
The year 1987 marked the arrival of over 40,000 foreign tourists to the nation’s coastal regions. However, this figure experienced a decline, dropping to approximately 35,000 visitors by 1992. The numbers then surged significantly, peaking at over 75,000 visitors by 2007. Conversely, visits to mountainous locations started at the second highest level of 20,000, progressing to over 30,000 in 1997. Thereafter, this figure stayed unaltered towards 2002 before a modest increment to about 38,000 in 2007.
The volume of international tourists visiting the country’s lakes saw consistent growth over the initial fifteen years, reaching a pinnacle of 75,000 visitors in 2002. Subsequently, there was a substantial decline in visitation, plummeting to 50,000 by the year 2007.
Sample 3:
The graph illustrates the number of tourists to three distinct regions in a European country, spanning from 1987 to 2007. Overall, the places have experienced an increased tourist attraction from the past two decades.
Initially, the coast, with around 40,000 visitors, was known to be the most popular region among the three. On the contrary, the lakes were the least liked, only comprising around 10,000 visitors. It is also notable that both the coast and the lakes had the same number of maximum visitors in this period, which was around 75,000.
By 2007, the coast had become the most popular tourist destination, having visited by almost 75,000 visitors. Although the lakes too saw a steep rise initially, the visitors started to decline, gaining the maximum attraction of approximately 75,000 tourists in 2002. By 2007, it had declined to 40,000 visitors. The mountains surprisingly did not experience any great inclination. They only had around 15,000 more visitors since 1987.
Sample 4:
The given graph illustrates the number of overseas travellers who visited three different attractions in a European country from 1987 to 2007. It is noticeable that the number of tourists visiting all the areas witnessed an upward trend over the given period.
In 1987, the coast attracted the most overseas visitors, with 40 thousand while the converse held true for the lakes, with only 10 thousand. Over the next two decades, the number of overseas tourists opting for the lakes rose gradually to approximately 35 thousand. Similarly, there was a dramatic jump in the number of visitors to the lakes to about 75 thousand, followed by a drop to 50 thousand in 2007.
At the beginning of the period, 20 thousand tourists from other countries visited the mountains. The mentioned attractions welcomed 30 thousand visitors in 1997 and the figure remained relatively stable until 2002. At the end of the period, the number of tourists to the mountains reached the highest point of 35 thousand.
Sample 5:
The given line graph depicts information about how many foreigners visited three separate regions in a European nation, during the span of a 20-year period from 1987 to 2007.
Overall, the most notable detail is that those three regions all attracted an increasing number of foreigners. In addition, the lakes’ tourist figures witnessed the most dramatic change among those given.
In more detail, at approximately 10,000 visitors in 1987, the quantity of foreign travelers who were attracted to the lakes gradually rose to around 50,000 in 2000, before peaking at approximately 75,000 tourists in 2002, This figure then dropped back down to approximately 50,000 people in 2007.
With regards to tourist numbers in coastal and mountainous areas, the overall figures increased, however mountainous areas remained the least attractive travel option out of the three. In 1987, the number of those who chose the coast as a travel destination stood at 40,000, compared to only 20,000 travelers who went to the mountains. In the next 14 years, the coast witnessed a slight decrease in the quantity of visitors by a few thousand, which was followed by a significant climb to around 60,000 people, whereas the number of those visiting mountainous areas went up remarkably to 30,000 in 2001.
In the final 6 years, while the quantity of overseas tourists going to the coast rose moderately to above 70,000, there was a slight climb in those who paid a visit to the mountains to about 35,000.
Sample 6:
The line chart details statistics about foreign travellers to three types of tourist destinations in an unspecified nation in Europe from 1987 to 2007. Overall, all categories witnessed an upswing with the most significant growth being seen in the number of tourists to the lakeside areas.
The coastal region welcomed the highest level of alien sightseers in the first year, at 40,000. Despite dipping to about 35,000 five years later, it recovered rapidly and consistently to approximately 76,000 in the final year.
Regarding the visitors to the mountainous attractions, this figure rose moderately from 20,000 in 1987 to 30,000 in 1997. Subsequently, it documented a period of stability until 2002, followed by a rise of nearly 7,000 by the end.
Finally, starting at the lowest result of 10,000 in the beginning, the number of overseas tourists to the lakes surged to 40,000 by 1997. In the next five years, it increased more sharply to a peak of just over 75,000 which surpassed the coast, before dropping quickly back to second position with 50,000 by 2007.
Sample 7:
The given outline is the number of people who have gone to the distinctive three places (the coast, the mountains, and the lakes) in the European nation from 1987 to 2000. Looking at the by-and-large structure it is quickly clear that the number of worldwide guests to the coast has diminished over the past five years. In spite of the first moo numbers, there has been a sharp increment in the number of guests to the lake by the conclusion, whereas those going to the mountains have expanded slowly.
After dissecting the chart, it can be seen that in 1987, 40% of worldwide people went by the coast which declined to around 35% in 1992. After that, the esteem expanded to roughly 75% in 2007. While, in 1987, 20% of universal people went to see the mountains which expanded consistently to around almost 33% in 2007.
In 1987, the rate of outside guests was 10%, expanding to 40% by 1997. This figure rose to 72% in 2002, sometime recently dropping to 50% in 2007. The coast had the most elevated guest numbers among the three zones. In the interim, both the coast and the mountains experienced development in their guest tallies.
Sample 8:
The line chart outlines the number of universal sightseers gone by the diverse three places in a European nation from 1887 to 2007. The unit is measured in thousands. By and large, it can be apparent that an expansive lion's share of guests went to Europe in 2002 and 2007, and a few thousand individuals in 1987. A look at the chart reveals that more at that point 70 thousand people went by the lakes in 2002, and the same number of individuals went to the mountains in 2007. Within the same year, a decrease was observed in the number of guests who went to lakes as it was 50 thousand. In 1987, as it was, 40 thousand individuals visited the coastal regions, and after that sudden expanded drift watched from 1992 to 2007.
For the mountain ranges, 20 thousand individuals went in 1987, and exceptionally few increases were observed over a period of time. Around 35 thousand sightseers went by the mountains in 2007.
Lời giải
Bạn cần đăng ký gói VIP ( giá chỉ từ 199K ) để làm bài, xem đáp án và lời giải chi tiết không giới hạn.
Lời giải
Bạn cần đăng ký gói VIP ( giá chỉ từ 199K ) để làm bài, xem đáp án và lời giải chi tiết không giới hạn.
Lời giải
Bạn cần đăng ký gói VIP ( giá chỉ từ 199K ) để làm bài, xem đáp án và lời giải chi tiết không giới hạn.
Lời giải
Bạn cần đăng ký gói VIP ( giá chỉ từ 199K ) để làm bài, xem đáp án và lời giải chi tiết không giới hạn.
Lời giải
Bạn cần đăng ký gói VIP ( giá chỉ từ 199K ) để làm bài, xem đáp án và lời giải chi tiết không giới hạn.