


Write a report about the information in the bar chart. Summarize the information by selecting and reporting the main features, and make comparisons where relevant. Write 180-200 words.
Write a report about the information in the bar chart. Summarize the information by selecting and reporting the main features, and make comparisons where relevant. Write 180-200 words.
Câu hỏi trong đề: 2000 câu trắc nghiệm tổng hợp Tiếng Anh 2025 có đáp án !!
Quảng cáo
Trả lời:
Sample 1:
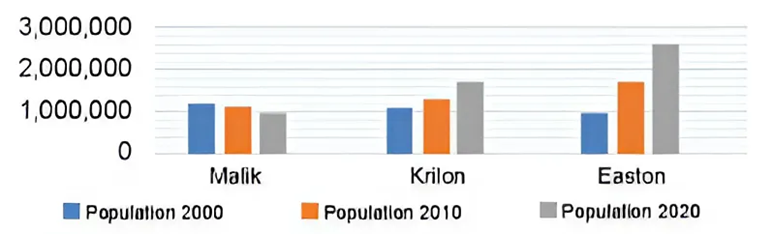
The bar chart illustrates the population growth in three cities - Malik, Krilon, and Easton - over the years 2000, 2010, and 2020.
In 2000, Malik and Krilon had similar populations, both around 1.2 million. However, by 2010, Malik's population remained relatively stable, while Krilon's population saw a slight increase to just over 1.5 million. In 2020, Malik experienced a modest increase to about 1.6 million, while Krilon's population grew more significantly, reaching approximately 2 million.
Easton, on the other hand, showed substantial population growth over the two decades. In 2000, Easton's population was about 1 million, lower than both Malik and Krilon. By 2010, Easton's population had increased dramatically to around 1.8 million, surpassing both Malik and Krilon. This trend continued, and by 2020, Easton's population had surged to nearly 3 million, making it the most populous city among the three.
In summary, Malik experienced minimal population growth over the 20-year period, while Krilon saw a steady increase. Easton, however, showed the most significant growth, with its population nearly tripling from 2000 to 2020. This suggests that Easton has been a major center of population growth compared to the more moderate increases in Malik and Krilon.
Sample 2:
The bar chart compares the population changes in the cities of Malik, Krilon, and Easton over the years 2000, 2010, and 2020.
In 2000, Malik and Krilon had similar populations, both around 1.5 million, while Easton had the smallest population at approximately 1 million. By 2010, Malik’s population remained almost unchanged at 1.5 million, whereas Krilon saw a slight increase to just over 1.5 million. Easton, however, experienced significant growth, with its population rising to about 1.8 million, surpassing both Malik and Krilon.
The trend continued over the next decade. By 2020, Malik’s population grew modestly to around 1.6 million. Krilon’s population increased more significantly to approximately 2 million. Easton, on the other hand, witnessed dramatic growth, with its population almost tripling from its 2000 figure, reaching nearly 3 million by 2020. This made Easton the most populous city among the three.
In summary, Malik showed the least population growth over the 20-year period, maintaining a relatively stable population. Krilon experienced steady growth, overtaking Malik by 2020. Easton displayed the most remarkable increase, with its population soaring to almost three times its initial size, highlighting Easton as a major hub of population growth compared to the more moderate increases in Malik and Krilon.
Sample 3:
The bar chart highlights notable population changes in the cities of Malik, Krilon, and Easton from 2000 to 2020.
In 2000, Malik and Krilon had similar populations, around 1.5 million each, while Easton was the smallest with about 1 million residents. By 2010, Malik’s population remained steady at approximately 1.5 million, whereas Krilon experienced a modest increase to just over 1.5 million. In contrast, Easton saw significant growth, with its population rising to about 1.8 million, surpassing both Malik and Krilon.
By 2020, Malik's population had only grown slightly to about 1.6 million, indicating minimal change over the 20 years. Krilon’s population increased more substantially to around 2 million, showing a steady growth trend. Easton exhibited the most dramatic change, with its population nearly tripling from its 2000 figure to reach almost 3 million by 2020.
In summary, Easton demonstrated the most significant population growth, far outpacing Malik and Krilon. While Malik saw minimal changes, Krilon experienced steady growth. Easton’s rapid expansion highlights it as a major center of population growth over the two decades.
Hot: 1000+ Đề thi cuối kì 2 file word cấu trúc mới 2026 Toán, Văn, Anh... lớp 1-12 (chỉ từ 60k). Tải ngay
CÂU HỎI HOT CÙNG CHỦ ĐỀ
Lời giải
- What is your favourite electronic device?
- What can it do for you now?
- What will it be able to do for you in the future?
My favourite electronic device is ________
Sample 1:
My favourite electronic device is a smartwatch.
Not only does it have timer functions like a regular watch, but it also offers an array of health and fitness monitoring features. It can monitor heart rate, steps taken, calories burned, daily exercise routines and stress levels. It allows me to stay connected without constantly checking smartphones. With just a smartwatch, I can receive notifications, text messages, call, and even immerse myself in my favorite music.
In the future, it can have more advanced health tracking features like blood oxygen, and blood pressure monitoring. In the context of constantly evolving technological innovation, it might use algorithms to predict health issues or provide personalized health recommendations based on gathered data.
Sample 2:
My favorite electronic device is my smartphone. Currently, it allows me to stay connected with friends and family through calls and messaging apps, browse the internet, take high-quality photos and videos, and manage my schedule with various productivity apps. In the future, I envision my smartphone being even more advanced, with capabilities such as real-time language translation, advanced artificial intelligence that can predict my needs and preferences, and enhanced augmented reality features for immersive experiences. Additionally, I hope it will have improved health monitoring tools, providing real-time health diagnostics and personalized wellness advice. These advancements will make my smartphone an even more indispensable tool in my daily life.
Sample 3:
My favorite electronic device is my laptop. Currently, it allows me to work efficiently with powerful software, browse the internet, stream movies and music, and connect with others through video calls and social media. In the future, I expect my laptop to have even more advanced features, such as seamless integration with virtual reality for immersive work and entertainment experiences, enhanced artificial intelligence to assist with tasks and provide personalized recommendations, and longer battery life with faster processing speeds. These improvements will make my laptop an even more essential and versatile tool in both my professional and personal life.
Sample 4:
My favorite electronic device is my tablet. At present, it serves as a portable tool for reading e-books, watching videos, playing games, and managing daily tasks with various apps. It also allows me to take notes and sketch with a stylus, making it perfect for both work and leisure. In the future, I hope my tablet will feature advanced augmented reality capabilities, more powerful processors for seamless multitasking, and enhanced battery life. Additionally, I look forward to improved handwriting recognition and AI-driven personal assistants that can help organize my life more efficiently.
Sample 5:
My favorite electronic device is my smartwatch. Right now, it tracks my fitness activities, monitors my heart rate, displays notifications from my smartphone, and even makes calls. It also helps me stay organized with reminders and calendar alerts. In the future, I envision my smartwatch becoming even more advanced, with features like comprehensive health monitoring that can detect potential health issues early, more sophisticated AI that offers personalized health and fitness advice, and seamless integration with other smart devices in my home. These advancements will make my smartwatch an even more integral part of my daily routine.
Lời giải
- Advantages:
+ People will have more time for leisure activities and family bonding.
+ They can answer questions about many topics.
- Disadvantages:
+ Humans can become dependent on Al technologies.
+ The cost of development and maintenance of robots is high.
Introduction
• People are beginning to use home robots.
• They have advantages and disadvantages.
______________
Body
• Advantages: Using home robots has several advantages. ______________
• Disadvantages: ______________
Conclusion
• Home robots may make lives easier and happier, but there are certain problems as well.
Sample 1:
People are beginning to use home robots. They have advantages and disadvantages. We must carefully consider the pros and cons before welcoming these robotic helpers into our homes.
Using home robots has several advantages. They free us from repetitive chores like cleaning, allowing more time for leisure activities and family bonding. Some robots even interact and play games, becoming companions, especially for those living alone.
However, there are downsides to consider. Reliance on AI can lead to a decline in critical thinking skills. Just like relying on calculators weakens mental math abilities, constantly turning to robots for solutions could weaken our ability to think creatively and solve problems independently. Additionally, robots can cultivate laziness, as tasks are completed without effort. Furthermore, the cost of development and maintenance is high. Robots require expensive parts and programming for each specific task. This investment may not be feasible for everyone.
Home robots may make lives easier and happier, but there are certain problems as well. While home robots can answer questions, provide information, and work tirelessly, the potential drawbacks cannot be ignored.
Sample 2:
People are beginning to use home robots, and while they offer various advantages, there are also notable disadvantages.
Using home robots has several advantages. Firstly, they allow people to have more time for leisure activities and family bonding. With robots handling household chores such as cleaning, cooking, and laundry, individuals can spend more quality time with their loved ones or pursue hobbies and relaxation. Additionally, home robots equipped with artificial intelligence can answer questions about many topics, providing instant information and assistance with tasks such as scheduling, shopping, and managing home security.
However, there are disadvantages to relying on home robots. One significant concern is that humans may become dependent on AI technologies, potentially losing essential skills and reducing human interaction. Over-reliance on robots for daily tasks could lead to a decline in problem-solving abilities and social interactions. Moreover, the cost of development and maintenance of robots is high. Investing in advanced home robots can be expensive and maintaining them may require ongoing expenses for repairs and updates.
In conclusion, while home robots can make lives easier and happier by saving time and providing valuable assistance, there are potential drawbacks, including dependency on technology and high costs. It is essential to balance the benefits with these challenges to ensure a harmonious integration of robots into daily life.
Sample 3:
As technology advances, home robots are becoming more prevalent in households. While they offer numerous benefits, they also come with certain drawbacks.
Using home robots has several advantages. Firstly, they provide people with more time for leisure activities and family bonding by taking over mundane household chores. For example, robots can handle tasks such as cleaning and cooking, allowing individuals to spend more quality time with their loved ones. Secondly, home robots are equipped with artificial intelligence, enabling them to answer questions on a wide range of topics. This can be especially useful for quick information retrieval, educational purposes, or even assisting with work-related queries.
However, there are also disadvantages associated with home robots. One significant concern is the potential for humans to become overly dependent on AI technologies. This reliance might lead to a decrease in essential life skills and a reduction in human interaction. Additionally, the cost of developing and maintaining these robots is high. Purchasing a home robot can be expensive, and ongoing maintenance and updates add to the financial burden, making it a less accessible option for many households.
In conclusion, while home robots can make life easier and potentially happier by saving time and providing valuable information, they also pose challenges such as dependency on technology and high costs. It is crucial to balance the benefits and drawbacks to fully integrate home robots into daily life.
Lời giải
Bạn cần đăng ký gói VIP ( giá chỉ từ 250K ) để làm bài, xem đáp án và lời giải chi tiết không giới hạn.
Lời giải
Bạn cần đăng ký gói VIP ( giá chỉ từ 250K ) để làm bài, xem đáp án và lời giải chi tiết không giới hạn.
Lời giải
Bạn cần đăng ký gói VIP ( giá chỉ từ 250K ) để làm bài, xem đáp án và lời giải chi tiết không giới hạn.
Lời giải
Bạn cần đăng ký gói VIP ( giá chỉ từ 250K ) để làm bài, xem đáp án và lời giải chi tiết không giới hạn.
Lời giải
Bạn cần đăng ký gói VIP ( giá chỉ từ 250K ) để làm bài, xem đáp án và lời giải chi tiết không giới hạn.