


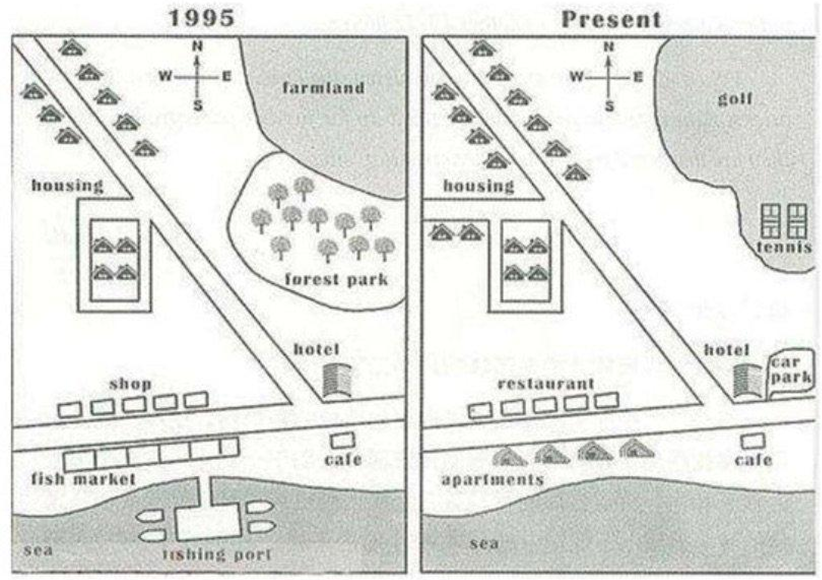
The map below shows the development of the village of Ryemouth between 1995 and present.
Summarise the information by selecting and reporting the main features, and make comparisons where relevant. Write at least 150 words.
The map below shows the development of the village of Ryemouth between 1995 and present.
Summarise the information by selecting and reporting the main features, and make comparisons where relevant. Write at least 150 words.
Câu hỏi trong đề: 2000 câu trắc nghiệm tổng hợp Tiếng Anh 2025 có đáp án !!
Quảng cáo
Trả lời:
Sample 1:
The map shows how a village called Ryemouth has developed over the last twenty-five years.
Overall, there have been several changes, the most noticeable being the increases in accommodation, the elimination of the fishing industry, and the introduction of sports facilities.
In 1995, to the south of the village where the sea is there was previously a fishing industry, with a fishing port and quite a large fish market as well. Next to this was a small cafe. On the other side of the road running by the sea stood a line of five shops and a hotel, while situated in the northeast part of the village was farmland and a park with trees. The main housing of the village was located in the northwest around a main road that runs from the coastal road, with twelve houses, four of them encircled by a smaller side-street.
Turning to the present-day map, it can be seen that the fishing facilities have all gone, being replaced by four apartments, and the shops have become restaurants. The cafe remains, as does the hotel, albeit with parking facilities which it did not have before. Having been converted into a golf course, the farmland has now gone, while the forest park has been removed to make way for tennis courts. Although the old houses remain, new ones have been built, along with a new road with two new houses beside it.
Sample 2:
The two maps shown below display a seaside village and how it has changed from 1995 to the present day.
Overall, the village represents a small-scale community and is situated to the North of the sea. There is a main road running along the sea from West to East, and another running from South-East to North-West. In both maps, there is a housing district located in the North-West corner of the village.
The most notable changes to the village from 1995 to the present day are the addition of a golf course and tennis courts where there used to be farmland and a forested area. Other changes include a new road which is running West and is roughly parallel to the seaside road.
In addition, the old shops and fish market in the South end have been transformed into seaside restaurants and apartments. The fishing port has also been removed, which opens up the beachfront.
Sample 3:
The map distinctly delineates the transformative development of the village of Ryemouth from the year 1995 to the present.
An overarching view of the maps highlights significant urban expansion and restructuring, particularly with the addition of residential areas and recreational facilities. The landscape has shifted from rural to a more suburban setup with enhanced amenities.
From 1995 to now, Ryemouth has seen the replacement of its fishing port and surrounding establishments with modern infrastructure. The erstwhile fish market and a row of shops have been superseded by contemporary apartment buildings and restaurants, enhancing the southern waterfront's appeal. This part of the village now serves as a bustling residential and commercial hub compared to its previous commercial focus on fishing.
In the northern section, where a forest park and farmland once prevailed, now lie a golf course and tennis courts, marking a shift towards recreational development. The presence of additional housing along the roads confirms an increase in the local population. Meanwhile, the central facilities like the hotel and cafe have remained, with the addition of a nearby car park to accommodate the growing influx of visitors and residents alike. This evolution reflects Ryemouth's transition from a primarily agrarian community to a more diversified suburban area.
Sample 4:
The maps provide an extensive illustration of the village's remarkable modifications between 1995 and the present day.
In general, the village map has undergone substantial changes with the significant increase in the number of houses and shops, and the conversion of farmland and woodlands into sports facilities. These new sporting facilities and the overall expansion of the village have brought about a significant transformation to the area's economic, social and physical landscape.
In the northeast of the village, a forest park now stands where there was once farmland. There are still several roads that run from north to south and east to west, with homes on both sides of the north-eastern road concentrated in the northwest corner of the village. On the east-west road, the same hotel and café established in 1995 continue to thrive. However, the southern side of the hamlet shows the most striking alterations.
In the present-day map, the fishing port has disappeared into the water, and a range of apartments and restaurants have taken the place of the former fish market and row of small shops. On the village's north-western side, four more houses have been built beside the roads. Moreover, a parking lot has been established by the hotel, and the former farmland and forest park have been transformed into a golf course and two tennis courts, offering residents new recreational opportunities.
Sample 5:
The illustrations reveal the extensive transformations that the Village of Ryemouth has undergone from 1995 to the present day.
Overall, the once fertile agrarian area in the north-eastern section of the village has now been transformed into a sporting ground, while the southern side of the village has seen the most significant changes, with the disappearance of the fishing port and the replacement of the former fish market and row of shops with apartment buildings and dining establishments.
The once-fertile agrarian area in the northeast of the village has been transformed into a golf course and two tennis courts. Despite this change, several roads still traverse the area, with homes on the north-eastern road maintaining their position in the northwest corner of the village. The east-west road is home to a hotel and café that have withstood the test of time.
However, the southern side of the hamlet has undergone the most significant changes, with the fishing port now vanished and replaced by apartments and dining establishments. The former fish market and row of small shops have made way for these modern developments. To the northwest of the village, four new homes have been added and a parking lot established by the hotel. In addition, the former agrarian land and forest park have been transformed into a golf course and two tennis courts, offering residents new recreational opportunities.
Sample 6:
The maps depict the major adjustments that a village has undergone between 1995 and the present.
In general, in addition to the substantial increase in the number of houses and shops, farmland and woodlands’ conversion to sporting grounds reveals the significant changes in the village map over the time.
A forest park was close to what used to be a farmland in the north-eastern portion. There used to be a few highways that went from north to south and from east to west. The homes constructed on each side of the north-east road were and continue to be centred on the village's northwest corner. On the east-west road, there is still the same hotel and café that were established next to one another in 1995. The south side of the hamlet, where there used to be a row of stores opposite a fish market that was close to the fishing port, is where the big alterations are most obvious.
In the current map, the fishing port has vanished into the water, while a number of apartments and restaurants have taken the place of the fish market and the row of small shops, respectively. Four more homes have been built to the residential facilities beside the roadways on the village's north-western side. In addition to the parking lot’s opening by the hotel, a golf course and two tennis courts have been built over the former farmland and the forest park.
Sample 7:
The maps illustrate the main changes which have taken place in a village from 1995 to the present day. Overall, the increased number of houses and apartments over the period indicates a significant rise to the village population.
In the past, there was a farmland in the northeast corner, and a forest park was next to it. A couple of roads crossed from north to south and from east to west which are still there. The houses built on both sides of the north-east route were and have always been centred to the northwest corner of the village. A hotel and a café built opposite each other on the east-west route are there the same as they were in 1995. However, the major changes are visible most in the south side of the village where there was a row of shops opposite a fish market which was near the fishing port.
Turning to the present scenario, four more houses have been added to the array of houses by the roads on the north-western side of the village. The farmland and forest park have been converted into a golf course and a couple of tennis courts. Fishing port is disappeared in the sea, while the the fish market and the line of shops are replaced with a number of apartments and restaurants, respectively. Also, a car park has been opened up by the hotel.
Sample 8:
The village of Ryemouth has witnessed significant changes since 1995, with many green spaces disappearing and new infrastructure emerging to meet the demands of a growing population and increased tourism.
In 1995, the village was located to the north of the sea, with a main road running from west to east along the coast, and another road intersecting it from southeast to northwest. In the northeast, there was a forest park and farmland, which have now been replaced by a golf course and tennis courts. Additionally, the northwest has seen the expansion of a road and the construction of new houses, although the main road remains unchanged.
Presently, several shops and fish markets in the southwest have been demolished to make way for restaurants and apartments near the beach, and the fishing port has disappeared. Despite these changes, the hotel and café in the northeast still stand, with a new car park added beside the hotel. Overall, Ryemouth has transformed from a primarily green area to one with more service-oriented facilities.
Sample 9:
The two maps show the layout of the same village in 1995 and at present. It is visible that there is a new infrastructure for housing and reconstruction that has been done at the cost of destroying the agricultural land and demolishing commercial fishing.
The most important changes that can be seen are the disappearance of the fishing port and the nearby fish market, as well as the creation of a golf course and tennis courts in the northeast, where farmland and a forest park were located in 1995. Moreover, a new housing development containing apartments is now found on the waterfront where the old fish market was located, and several restaurants have been built on the opposite side of these apartments, on the road where previously shops were located.
There is also an increase in the total number of houses, from 12 in 1995 to 16 at present. Also, the road towards a small housing development west of the main road has been extended further. The hotel and cafe in the south-east have remained the same. A new car parking area has been constructed next to the hotel.
Sample 10:
The given maps highlight alterations to the layout of the Tynemouth village from 1995 to the present time. Overall, the village has undergone drastic changes, in terms of the housing area and utilities buildings. In return, certain infrastructure has been demolished.
A closer look at the map reveals that the residential area situated to the West of the village has been extended further to construct more dwellings for citizens, and the number of houses has also increased to 16. In 1995, there used to be an agricultural land and a forest park in the northeast, but now it has been converted into a sports complex, which comprises a vast golf course and a tennis court.
Regarding the lower half of the village, new apartment blocks have taken place of the previous fish market, which was simultaneously removed with the commercial fishing port. In front of these condominiums lies a shopping center, which is now repurposed as an eatery. Noteworthily, the cafe and the hotel remained unchanged for over two decades, except for the fact that a new parking lot has been constructed adjacent to the latter.
Sample 11:
The two maps depict the changes that have taken place in Ryemouth village from 1995 to the current time.
It is evident that commercial structures like a golf course and tennis courts have been set up at the cost of the green cover of the village. Additionally, the structures that supported fishing have completely disappeared.
The most significant changes that have happened are the demolition of the fishing port and the fish market located on the south coast of Ryemouth. Apartments have been built in place of the fish market on the south side of the road which runs parallel to the sea. Additionally, several restaurants have replaced the shops on the north side of the road.
Further, a golf course and tennis courts have been constructed in the northeast of Ryemouth, in place of the farmland and forest park which existed in 1995. There is also an increase in the total number of houses, from 12 in 1995 to 16 at present. The hotel and cafe in the southeast part of Ryemouth have not changed in any way except for a new car parking area that has been constructed next to the hotel.
Sample 12:
The given map illustrates the transformations of a village from 1995 to the present.
Overall, the village has undergone notable changes with a significant reduction in green areas and an increase in housing and service-related facilities. Specifically, while features like the forest park have disappeared, new amenities such as housing and recreational areas have emerged.
In 1995, the village was located to the north of the sea. A main road ran parallel to the sea from west to east, intersected by another road extending from the southeast to the northwest. In the northeast, there was a forest park and farmland, which have since been replaced by golf and tennis courts. The main road has remained unchanged, but the northwest has seen the expansion of roads and the construction of new houses.
Currently, a series of shops and fish markets in the southwest have been demolished to make way for restaurants and apartments. The fishing port near the ocean has also disappeared. In the northeast, the hotel and café still stand opposite each other, with the addition of a car park adjacent to the hotel. These changes reflect the village's shift towards accommodating a growing population and increased tourism.
Sample 13:
The given map illustrates how Ryemouth village has developed from the year 1995 to the present. Among many changes, the most noticeable one is the increase in accommodation, as well as the replacement of the fishing facilities and farmland by other residential areas.
In the year 1995, there was a fishing port and a fish market in the South of Ryemouth village. On the other side of the street were several shops and a hotel. Located in the Northeast of the village were a farmland and a forest park. In addition, the housing was situated on the Northwest side.
According to the current map, it can be seen that the fish market and fishing port were replaced by some apartments. The shops became restaurants, whereas the hotel and café still remain the same. Furthermore, a new car park is built next to the hotel. Another replacement also occurs in the Northeast, with a golf and tennis court added. Additionally, new houses and roads have been built in the Northwest.
Sample 14:
The maps illustrate the changes that occurred in the village near the seashore between 1995 to the present time.
Starting from the western side sea which had fishing port in the year 1995, this disappeared later. Parallel to the sea, there is a road running East to West. The fish market on the south of this road was replaced by sea facing apartments while the cafe on the South-East side is intact. Shops which were on the opposite side of the fish market are converted into restaurants. A car parking is seen adjacent to the hotels in the present time.
In the year 1995, the North-east side was occupied by farmland and forest park. These later disappeared as golf course and tennis courts take the place. Road from North-West to the South-east had houses on both the side in the former direction. The count in later period hiked and the road encircling a small housing development west of the main road has been extended further westward.
Overall, remarkable development in the village occurred but at the expense of farming land and fishing.
Sample 15:
The map illustrates the development of Ryemouth village over the past twenty-five years. It showcases significant changes in accommodation, the decline of the fishing industry, and the addition of sports facilities.
In 1995, to the south of the village, there was a thriving fishing industry with a port and fish market, accompanied by a small cafe. Across the road were five shops and a hotel, while farmland and a park were in the northeast. The main housing area was in the northwest, with twelve houses, including four accessed via a side street.
In the present-day map, the fishing facilities have been replaced by four apartments, and the shops have been transformed into restaurants. The cafe and hotel remain, with the addition of parking facilities for the hotel. A golf course has replaced the farmland, and tennis courts have replaced the forest park.
Some old houses have survived the massive development, and new ones have been built along with a new road, with two adjacent houses.
Sample 16:
The maps demonstrated the evolution of Ryemouth, a village, from 1995 to the present.
It was obvious that the village has changed dramatically since 1995. From themaps, it appeared as though the fishing port and a sizable amount of green space have vanished. The infrastructure of the hamlet has also been updated with the installation of some new lodging, entertainment, and dining options.
According to the map from 1995, the farmland was to the north-east of shop and aforest park was directly opposite the farmland. But now they were completely chopped down to make way for a golf and two tennis courts. Despite the additionof a new parking lot on the hotel's right side, we can still make out a hotel and acafe that haven't altered much since 1995.
More houses were constructed in the northeast. Two homes blocks next to the main highway have grown as a result of the arrival of two more blocks. Two homes were erected on a new road that was added and traveled through the housingsquare. The shop was at right angles to the fishing port, which were replaced by restaurant and apartments.
Hot: 1000+ Đề thi cuối kì 2 file word cấu trúc mới 2026 Toán, Văn, Anh... lớp 1-12 (chỉ từ 60k). Tải ngay
CÂU HỎI HOT CÙNG CHỦ ĐỀ
Lời giải

Sample 1:
The bar graph illustrates the overseas students' spending on accommodation, tuition, and living expenses, while the table depicts information about the average weekly expenses by international students in four countries: A, B, C, and D.
Overall, foreign students need to spend the highest in country A and the lowest in D. In nearly every nation, the international students’ weekly average living expenses are the greatest, while their housing cost registers the lowest.
The costliest country for studying is A, with a weekly average expense of 875 dollars. This is followed by B, C, and D, which have weekly expenses of 735, 540, and 435 dollars, respectively. However, foreign students always pay the least for accommodation, which incurs on average weekly 220, 280, 240, and 200 dollars in the nations A, B, C, and D, respectively.
On the other hand, living expenditures account for the highest portion of average weekly costs for international students in countries A, B, and C, with 430, 350, and 275 dollars, correspondingly. Tuition fees in the same countries (A, B and C) come in second with the weekly averages of 358, 320, and 250 dollars in order. However, D is the only nation where education accounts for the highest average spending area, coming in at USD 235, followed by the cost of living (USD 225) and housing (USD 200).
Sample 2:
The table illustrates information regarding the weekly spendings by overseas students in four countries, A, B, C and D, while the bar graph depicts the students’ expenditure on the sectors, housing, education fees and living expenses.
Overall, the cost of studying abroad is the highest in country A and the lowest in D. Apart from country D, living costs account for the most part of the weekly spendings in all countries, while accommodation registers the least.
Regarding the total cost of studying, A is the most expensive country with weekly average 875 dollars, followed by B, C and D with 735, 540 and 435 dollars, respectively. On the other hand, the overseas students always spend the least on accommodation, which are on average weekly 220, 280, 240 and 200 dollars in the corresponding countries A, B, C and D.
Considering the living cost, it takes the largest share of foreign students’ average weekly expenses in countries A, B, and C with 430, 350 and 275 dollars, respectively, while tuition fees in the same countries hold the second place with weekly average 358, 320 and 250 dollars, sequentially. However, D is the only country where tuition fee occupies the highest expenditure with average weekly 235 dollars, followed by living cost (USD 225) and accommodation (USD 200.)
Sample 3:
The table and bar graph depict information regarding the weekly spendings by overseas students in countries A, B C and D.
Overall, there are three elements, housing, school fees and living costs that contribute to the total weekly spendings. The total expenditure in country A is the highest while it is the lowest in country D. Living costs account for the most part of the weekly spendings in all countries except D.
The total mean weekly cost for pupils to study in country A is US$875, next by country B at US$735, and then by country C at US$540, and finally by country D at US$435. The living costs are always the biggest component of the expenditure except for country D, with about US$10 less than the major spending which is the school fees.
Accommodation accounts for the least among all spendings in all countries. The most expensive housing is found in country B, at US$280, and the cheapest in country D at US$200. The middle range can be seen in country A at US$220 and country C at US$240, respectively. Costs of the tuition fee range between US$ 358 and US$235 in country A and D, in order.
Lời giải

Sample 1:
The bar chart and pie chart give information about why US residents travelled and what travel problems they experienced in the year 2009.
It is clear that the principal reason why Americans travelled in 2009 was to commute to and from work. In the same year, the primary concern of Americans, with regard to the trips they made, was the cost of travelling.
Looking more closely at the bar chart, we can see that 49% of the trips made by Americans in 2009 were for the purpose of commuting. By contrast, only 6% of trips were visits to friends or relatives, and one in ten trips were for social or recreation reasons. Shopping was cited as the reason for 16% of all travel, while unspecific ‘personal reasons’ accounted for the remaining 19%.
According to the pie chart, price was the key consideration for 36% of American travellers. Almost one in five people cited safety as their foremost travel concern, while aggressive driving and highway congestion were the main issues for 17% and 14% of the travelling public. Finally, a total of 14% of those surveyed thought that access to public transport or space for pedestrians were the most important travel issues.
Sample 2:
The bar chart compares the figures for Americans going out for five reasons and the pie chart illustrates the percentage of six problems that concerned them when travelling in 2009. Overall, it is clear that the main reason why people in the US went out in 2009 is to commute to work, and the cost of travelling is the problem concerning them the most.
Looking first at the bar graph, the proportion of Americans going out for commuting to work stood at 49%, while the figure for those leaving their house for personal reasons accounted for 19%. In addition, the rate of people in the US going out for shopping and recreation made up 16% and 10%, respectively, while visiting friends or relatives accounted for the lowest percentage, at only 6%.
Turning to the pie chart, the cost of travelling was the most concerning problem of Americans when going out, with the figure making up 36%, while the proportion of safety concerns is half of that, at 19%. In addition, 17% of US citizens were concerned about aggressive drivers, while highway congestion made 14% of them worried when leaving their house. Access to public transportation and places for people to walk accounted for the lowest percentages, at only 8% and 6%, respectively.
Sample 3:
The provided charts offer insights into the reasons for travel and the primary concerns faced by the traveling public in the United States during the year 2009. The data is presented through a bar chart illustrating travel purposes and a pie chart highlighting key issues.
Notably, the primary motivation for travel among Americans in 2009 was commuting to and from work. Simultaneously, the major concern for the traveling public during their trips revolved around the cost associated with travel.
Examining the bar chart in detail reveals that almost half of the trips made by Americans in 2009, precisely 49%, were attributed to commuting. Conversely, visits to friends or relatives accounted for a mere 6%, while social or recreational trips constituted one in ten journeys. Shopping emerged as the purpose for 16% of all travel, leaving the remaining 19% for unspecific ‘personal reasons.’
Turning attention to the pie chart, it becomes evident that cost was the primary consideration for 36% of American travelers. Safety closely followed, with nearly one in five people, or 19%, expressing it as their foremost travel concern. Aggressive driving and highway congestion were significant issues for 17% and 14% of the traveling public, respectively. Additionally, 14% of respondents identified access to public transport or space for pedestrians as the most crucial travel issues.
Sample 4:
The bar chart shows why American people chose to travel, and the pie chart shows the main issues for the travelling public in the USA, both for 2009. The trend suggests that the reason and price were the main issues for travel in the United States. It is clear that commuting from work was reported as the biggest contribution to travel, at 49%. People who went travelling for personal reasons and shopping accounted for 35% when these two groups are combined. However, interaction with friends and relatives only accounted for 25% less than the above categories. And social and recreational activities took up only 6%, which was the lowest figure by more than 43%. The travelling public’s main issues were related to price and safety, with 55% of respondents reporting these two issues. While other issues accounted for a relatively small part. Only 17% of the respondents reported issues with aggressive drivers, while highway congestion accounted for even less at 14% of the issues reported. The percentage of access to public transport and space for pedestrians was much lower than the other categories at less than 10% for both. To conclude, price and commuting time were the dominant factors relating to travel in the US in 2009.
Lời giải
Bạn cần đăng ký gói VIP ( giá chỉ từ 250K ) để làm bài, xem đáp án và lời giải chi tiết không giới hạn.
Lời giải
Bạn cần đăng ký gói VIP ( giá chỉ từ 250K ) để làm bài, xem đáp án và lời giải chi tiết không giới hạn.
Lời giải
Bạn cần đăng ký gói VIP ( giá chỉ từ 250K ) để làm bài, xem đáp án và lời giải chi tiết không giới hạn.
Lời giải
Bạn cần đăng ký gói VIP ( giá chỉ từ 250K ) để làm bài, xem đáp án và lời giải chi tiết không giới hạn.