






















The bar charts illustrate the average house expenses in England and its capital city – London, and to present the comparison regarding the average house prices between distinct areas of England within the year 2013.
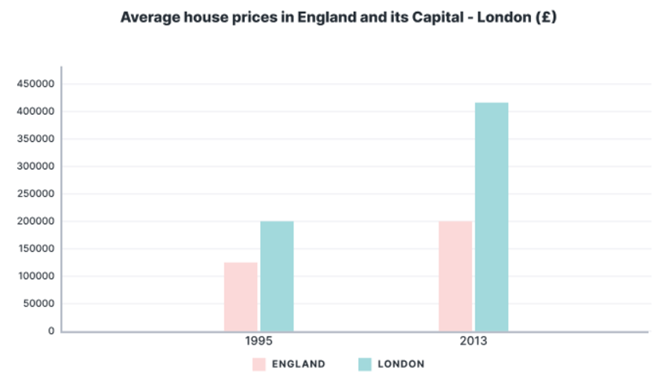
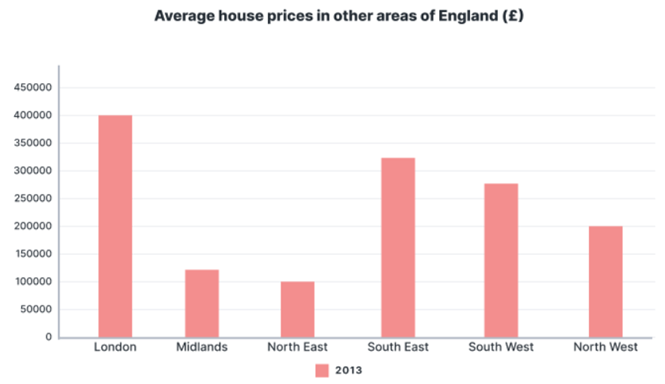
The bar charts illustrate the average house expenses in England and its capital city – London, and to present the comparison regarding the average house prices between distinct areas of England within the year 2013.
Câu hỏi trong đề: 3000 câu Trắc nghiệm tổng hợp Tiếng Anh 2026 (có đáp án) !!
Quảng cáo
Trả lời:
 Giải bởi Vietjack
Hướng dẫn giải:
Gợi ý 1:
The bar charts illustrate the average house prices in England and its capital city, London, in 1995 and 2013, as well as the average prices in different regions of England in 2013. Overall, house prices increased significantly over the period, with London remaining the most expensive area.
In 1995, the average house price in England was around £125,000, while in London it was higher, at approximately £200,000. By 2013, both figures had risen considerably. The average price in England doubled to £200,000, whereas in London it more than doubled, reaching about £425,000. This indicates that the growth rate in London was much faster than the national average.
The second chart shows the variation in house prices across different regions of England in 2013. London had the highest average price, at roughly £400,000, followed by the South East (£320,000) and the South West (£280,000). In contrast, the North East had the lowest average price, at only £100,000, while the Midlands and North West were moderately priced at £120,000 and £200,000 respectively.
In summary, house prices rose sharply between 1995 and 2013, especially in London, which remained far more expensive than other regions of England.
(Các biểu đồ cột minh họa giá nhà trung bình ở Anh và thủ đô London vào năm 1995 và 2013, cũng như giá trung bình ở các vùng khác của Anh trong năm 2013. Nhìn chung, giá nhà tăng mạnh trong giai đoạn này, với London vẫn là khu vực đắt đỏ nhất.
Năm 1995, giá nhà trung bình ở Anh khoảng £125,000, trong khi ở London cao hơn, khoảng £200,000. Đến năm 2013, cả hai con số đều tăng đáng kể. Giá trung bình ở Anh tăng gấp đôi lên £200,000, còn ở London tăng hơn gấp đôi, đạt khoảng £425,000. Điều này cho thấy tốc độ tăng giá ở London nhanh hơn nhiều so với mức trung bình toàn quốc.
Biểu đồ thứ hai thể hiện sự khác biệt về giá nhà giữa các vùng của Anh năm 2013. London có giá trung bình cao nhất, khoảng £400,000, tiếp theo là vùng Đông Nam (£320,000) và Tây Nam (£280,000). Ngược lại, vùng Đông Bắc có giá thấp nhất, chỉ £100,000, trong khi vùng Midlands và Tây Bắc có giá trung bình lần lượt là £120,000 và £200,000.
Tóm lại, giá nhà tăng mạnh từ năm 1995 đến 2013, đặc biệt ở London, nơi vẫn đắt hơn nhiều so với các vùng khác của Anh.)
Gợi ý 2:
The two bar charts compare average house prices in England and London in 1995 and 2013, and show the average prices in various regions of England in 2013. It is clear that house prices increased dramatically over time, with London being the most expensive area by a large margin.
In 1995, houses in England cost around £125,000 on average, while those in London were priced at about £200,000. By 2013, the figures had risen to £200,000 and £425,000 respectively. This means that London’s house prices more than doubled, whereas the national average increased by roughly 60%.
The second chart reveals regional differences in 2013. London had the highest average house price, at £400,000, followed by the South East (£320,000) and the South West (£280,000). The North East was the cheapest region, with houses costing only £100,000 on average. The Midlands and North West were also relatively affordable, with prices of £120,000 and £200,000 respectively.
Overall, house prices in England rose substantially between 1995 and 2013, and London continued to dominate as the most expensive housing market in the country.
(Hai biểu đồ cột so sánh giá nhà trung bình ở Anh và London vào năm 1995 và 2013, đồng thời thể hiện giá trung bình ở các vùng khác của Anh năm 2013. Rõ ràng rằng giá nhà tăng mạnh theo thời gian, với London là khu vực đắt đỏ nhất.
Năm 1995, giá nhà trung bình ở Anh khoảng £125,000, trong khi ở London là £200,000. Đến năm 2013, các con số tăng lên £200,000 và £425,000 tương ứng. Điều này có nghĩa là giá nhà ở London tăng hơn gấp đôi, trong khi mức trung bình toàn quốc tăng khoảng 60%.
Biểu đồ thứ hai cho thấy sự khác biệt giữa các vùng năm 2013. London có giá nhà trung bình cao nhất, £400,000, tiếp theo là vùng Đông Nam (£320,000) và Tây Nam (£280,000). Vùng Đông Bắc là nơi rẻ nhất, với giá trung bình chỉ £100,000. Midlands và Tây Bắc cũng tương đối rẻ, với giá lần lượt là £120,000 và £200,000.
Nhìn chung, giá nhà ở Anh tăng đáng kể từ năm 1995 đến 2013, và London vẫn là thị trường nhà ở đắt đỏ nhất cả nước.)
Hot: Giáo án năng lực số, PPT AI khởi động lớp 1-12 (Update 2026) (chỉ từ 150k). Tải ngay
CÂU HỎI HOT CÙNG CHỦ ĐỀ
Lời giải
Hướng dẫn giải:
Gợi ý 1:
Nowadays, more and more people prefer to get news online rather than through newspapers or television. This shift is mainly due to convenience and accessibility, and I believe it is largely a positive development.
One reason people turn to the internet is speed. Online platforms provide instant updates, whereas newspapers and TV programs often report events hours later. In addition, the internet offers a wider range of sources, allowing readers to access international news and diverse perspectives. Another factor is flexibility. People can read or watch news on their smartphones anytime and anywhere, unlike traditional media which requires fixed schedules or physical copies.
This trend has several positive effects. It encourages people to stay informed more regularly and promotes global awareness. Furthermore, digital platforms often allow interaction, such as commenting or sharing, which makes news more engaging. However, there are drawbacks, such as the spread of misinformation and reduced trust in online sources.
In conclusion, the growing reliance on the internet for news is driven by convenience and speed. Although it poses challenges, I believe it is a positive development overall, provided that people learn to evaluate sources critically.
(Ngày nay, ngày càng nhiều người thích đọc tin tức trực tuyến hơn là qua báo in hoặc truyền hình. Sự thay đổi này chủ yếu do tính tiện lợi và khả năng tiếp cận, và tôi tin rằng đây phần lớn là một sự phát triển tích cực.
Một lý do khiến mọi người chuyển sang internet là tốc độ. Các nền tảng trực tuyến cung cấp cập nhật tức thì, trong khi báo và chương trình TV thường đưa tin muộn hơn nhiều giờ. Ngoài ra, internet mang lại nhiều nguồn tin hơn, cho phép người đọc tiếp cận tin tức quốc tế và nhiều góc nhìn khác nhau. Một yếu tố khác là sự linh hoạt. Mọi người có thể đọc hoặc xem tin tức trên điện thoại thông minh bất cứ lúc nào, khác với truyền thông truyền thống vốn yêu cầu lịch trình cố định hoặc bản in.
Xu hướng này có nhiều tác động tích cực. Nó khuyến khích mọi người cập nhật thông tin thường xuyên hơn và nâng cao nhận thức toàn cầu. Hơn nữa, các nền tảng kỹ thuật số thường cho phép tương tác, như bình luận hoặc chia sẻ, khiến tin tức hấp dẫn hơn. Tuy nhiên, cũng có hạn chế như sự lan truyền thông tin sai lệch và giảm niềm tin vào nguồn trực tuyến.
Tóm lại, việc ngày càng phụ thuộc vào internet để đọc tin tức xuất phát từ sự tiện lợi và tốc độ. Mặc dù có thách thức, tôi tin rằng đây là một sự phát triển tích cực, miễn là mọi người biết cách đánh giá nguồn tin một cách cẩn trọng.)
Gợi ý 2:
The internet has become the primary source of news for many people, replacing newspapers and television. This change is driven by technological advancement and changing lifestyles, and it has both benefits and drawbacks.
People prefer online news because it is immediate and accessible. Unlike newspapers, which are printed once a day, or TV programs that follow fixed schedules, online platforms update continuously. Moreover, the internet provides multimedia content—videos, images, and live streams—that make news more engaging. Another reason is cost. Most online news is free, whereas newspapers require payment and television often demands subscriptions.
This development is positive in many ways. It democratizes information, giving people access to diverse viewpoints and breaking news at their fingertips. It also reduces paper consumption, which benefits the environment. However, the negative side is the rise of fake news and sensationalism, which can mislead readers. Traditional journalism often has stricter editorial standards, while online platforms sometimes prioritize speed over accuracy.
To sum up, the internet has become the dominant source of news because it is fast, convenient, and cost-effective. While this is mostly positive, society must address the issue of misinformation to maximize its benefits.
(Internet đã trở thành nguồn tin tức chính của nhiều người, thay thế báo in và truyền hình. Sự thay đổi này được thúc đẩy bởi tiến bộ công nghệ và lối sống thay đổi, và nó có cả mặt lợi và hại.
Mọi người thích tin tức trực tuyến vì nó nhanh chóng và dễ tiếp cận. Khác với báo in chỉ phát hành một lần mỗi ngày hoặc chương trình TV theo lịch cố định, các nền tảng trực tuyến cập nhật liên tục. Hơn nữa, internet cung cấp nội dung đa phương tiện—video, hình ảnh và phát trực tiếp—khiến tin tức hấp dẫn hơn. Một lý do khác là chi phí. Hầu hết tin tức trực tuyến miễn phí, trong khi báo in phải trả tiền và truyền hình thường yêu cầu đăng ký.
Sự phát triển này có nhiều mặt tích cực. Nó dân chủ hóa thông tin, giúp mọi người tiếp cận nhiều quan điểm và tin nóng ngay trong tầm tay. Nó cũng giảm tiêu thụ giấy, có lợi cho môi trường. Tuy nhiên, mặt tiêu cực là sự gia tăng tin giả và giật gân, có thể gây hiểu lầm cho người đọc. Báo chí truyền thống thường có tiêu chuẩn biên tập nghiêm ngặt hơn, trong khi nền tảng trực tuyến đôi khi ưu tiên tốc độ hơn độ chính xác.
Tóm lại, internet đã trở thành nguồn tin tức chủ đạo vì nó nhanh, tiện lợi và tiết kiệm chi phí. Mặc dù phần lớn là tích cực, xã hội cần giải quyết vấn đề thông tin sai lệch để tận dụng tối đa lợi ích của nó.)
Lời giải
Hướng dẫn giải:
Gợi ý 1:
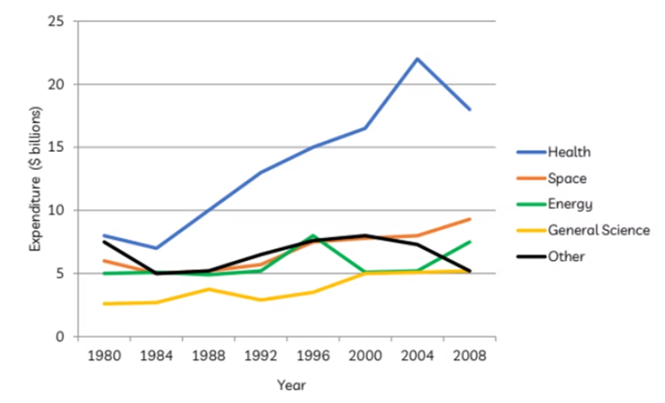
The line graph illustrates how much money the U.S. government spent on research in five different sectors—health, space, energy, general science, and other areas—from 1980 to 2008. Overall, expenditure on health research increased dramatically, while spending on other sectors remained relatively stable or declined slightly.
In 1980, health research received the highest funding at around $8 billion, followed by other areas and space at approximately $7 billion and $6 billion respectively. Energy and general science were the least funded sectors, both below $5 billion. Over the next two decades, spending on health rose steadily, reaching a peak of nearly $20 billion in 2004 before falling slightly by 2008.
By contrast, expenditure on space research grew gradually from $6 billion to about $9 billion by 2008. Energy research fluctuated, peaking at around $9 billion in 1996 before dropping to $6 billion in 2008. General science showed a modest upward trend, increasing from $3 billion to $5 billion. Spending on other areas remained stable until 2000, then declined to $5 billion by the end of the period.
In summary, health research consistently attracted the most funding, while other sectors experienced minor changes or declines over the 28-year period.
(Biểu đồ đường minh họa số tiền mà chính phủ Hoa Kỳ chi cho nghiên cứu trong năm lĩnh vực khác nhau — y tế, không gian, năng lượng, khoa học tổng quát và các lĩnh vực khác — từ năm 1980 đến 2008. Nhìn chung, chi tiêu cho nghiên cứu y tế tăng mạnh, trong khi các lĩnh vực khác tương đối ổn định hoặc giảm nhẹ.
Năm 1980, nghiên cứu y tế nhận được nguồn tài trợ cao nhất, khoảng 8 tỷ USD, tiếp theo là các lĩnh vực khác và không gian với khoảng 7 tỷ và 6 tỷ USD. Năng lượng và khoa học tổng quát là hai lĩnh vực được tài trợ ít nhất, đều dưới 5 tỷ USD. Trong hai thập kỷ tiếp theo, chi tiêu cho y tế tăng đều, đạt đỉnh gần 20 tỷ USD vào năm 2004 trước khi giảm nhẹ vào năm 2008.
Ngược lại, chi tiêu cho nghiên cứu không gian tăng dần từ 6 tỷ lên khoảng 9 tỷ USD vào năm 2008. Nghiên cứu năng lượng biến động, đạt đỉnh khoảng 9 tỷ USD vào năm 1996 rồi giảm xuống 6 tỷ USD vào năm 2008. Khoa học tổng quát tăng nhẹ từ 3 tỷ lên 5 tỷ USD. Chi tiêu cho các lĩnh vực khác ổn định đến năm 2000, sau đó giảm xuống 5 tỷ USD vào cuối giai đoạn.
Tóm lại, nghiên cứu y tế luôn nhận được nguồn tài trợ lớn nhất, trong khi các lĩnh vực khác chỉ có thay đổi nhỏ hoặc giảm nhẹ trong suốt 28 năm.)
Gợi ý 2:
The graph shows U.S. government expenditure on research in five fields—health, space, energy, general science, and other—from 1980 to 2008. It is clear that spending on health rose sharply, whereas other categories saw little growth or even a decline.
In 1980, health was the largest area of investment, at about $8 billion, while space and other sectors followed closely behind. Energy and general science received the least funding, at around $5 billion and $3 billion respectively. Between 1980 and 2004, health spending increased significantly, reaching a peak of $20 billion before falling slightly to $17 billion in 2008.
Space research funding grew steadily throughout the period, rising from $6 billion to $9 billion. Energy spending fluctuated, peaking at $9 billion in the mid-1990s but ending lower at $6 billion. General science showed a slow but consistent increase, while expenditure on other areas remained stable until 2000 and then declined.
Overall, the U.S. government prioritized health research, with its funding far exceeding that of other sectors by the end of the period.
(Biểu đồ cho thấy chi tiêu của chính phủ Hoa Kỳ cho nghiên cứu trong năm lĩnh vực — y tế, không gian, năng lượng, khoa học tổng quát và các lĩnh vực khác — từ năm 1980 đến 2008. Rõ ràng rằng chi tiêu cho y tế tăng mạnh, trong khi các lĩnh vực khác tăng ít hoặc giảm.
Năm 1980, y tế là lĩnh vực được đầu tư nhiều nhất, khoảng 8 tỷ USD, trong khi không gian và các lĩnh vực khác theo sau. Năng lượng và khoa học tổng quát nhận được ít tài trợ nhất, lần lượt khoảng 5 tỷ và 3 tỷ USD. Từ năm 1980 đến 2004, chi tiêu cho y tế tăng đáng kể, đạt đỉnh 20 tỷ USD trước khi giảm nhẹ xuống 17 tỷ USD vào năm 2008.
Chi tiêu cho nghiên cứu không gian tăng đều trong suốt giai đoạn, từ 6 tỷ lên 9 tỷ USD. Năng lượng biến động, đạt đỉnh 9 tỷ USD vào giữa thập niên 1990 nhưng kết thúc thấp hơn ở mức 6 tỷ USD. Khoa học tổng quát tăng chậm nhưng ổn định, trong khi chi tiêu cho các lĩnh vực khác giữ nguyên đến năm 2000 rồi giảm.
Nhìn chung, chính phủ Hoa Kỳ ưu tiên nghiên cứu y tế, với nguồn tài trợ vượt xa các lĩnh vực khác vào cuối giai đoạn.)
Lời giải
Bạn cần đăng ký gói VIP ( giá chỉ từ 250K ) để làm bài, xem đáp án và lời giải chi tiết không giới hạn.
Lời giải
Bạn cần đăng ký gói VIP ( giá chỉ từ 250K ) để làm bài, xem đáp án và lời giải chi tiết không giới hạn.
Lời giải
Bạn cần đăng ký gói VIP ( giá chỉ từ 250K ) để làm bài, xem đáp án và lời giải chi tiết không giới hạn.
Lời giải
Bạn cần đăng ký gói VIP ( giá chỉ từ 250K ) để làm bài, xem đáp án và lời giải chi tiết không giới hạn.
Lời giải
Bạn cần đăng ký gói VIP ( giá chỉ từ 250K ) để làm bài, xem đáp án và lời giải chi tiết không giới hạn.
 Nhắn tin Zalo
 Hỏi bài tập